Introducing the Software Map in Qodo: Risk, Mapped Across Every Repo

Most engineering organizations have a diagram of their architecture. Almost none of them describe the system as it exists today.
That was survivable when code moved at human speed. A service got added every few months. Someone updated the wiki page eventually. The two or three engineers who held the whole system in their heads filled in whatever the diagram missed.
AI changed the rate. Faros AI’s 2026 engineering report found that under high AI adoption, the number of files edited per pull request rose 59.7%, files touched per developer per month rose 149.9%, and incidents per pull request rose 242.7%.
Most people read numbers like these as a review problem. More code, less time to look at it, more defects getting through. That is part of it. The part that gets missed is the second number. Those files are not just more lines of code. It is more calls between services, more implicit contracts, more dependencies that nobody sat in a room and designed. Agents are adding structure to your architecture at the same rate they are adding code to your repos, and nothing in your organization is tracking that.
You cannot govern a system you cannot see. That is why we built the Software Map in Qodo, and it is live today.
The system outgrew the people who hold it in their heads
Across the engineering orgs we work with, the pattern repeats at every size. A few people understand how the whole thing fits together, and every meaningful architecture decision queues behind one of them. They are the documentation. They are also the bottleneck, and now they are being asked to review AI-generated changes that touch parts of the system nobody has opened in a year.
Downstream impact gets discovered the same way it always has – after something breaks. A new senior hire spends a week in meetings assembling a mental model that should have taken an hour. And the question a VP of Engineering cannot answer with any precision is the one that matters most right now: which parts of my system carry the most risk today, and where is that risk increasing?
None of these are knowledge problems. Everything needed to answer them is in the code. It has never been assembled into anything anyone can look at, especially at the level of depth the agentic SDLC requires.
Diagrams and catalogs were never built for this
Teams have tried to solve this twice.
The first attempt is the architecture diagram. Someone draws it during a planning cycle, it is accurate for about a week, and from then on it records what one person believed at one moment.
The second is the service catalog. Backstage, Cortex, OpsLevel, Port. Engineers register services by hand in YAML, which is exactly why catalogs drift out of date almost immediately. A registry that depends on humans keeping entries current will always lag a codebase that agents are changing hourly.
Then there are the system mapping tools that derive structure automatically from runtime logs and static analysis. They operate at the application, service, or cloud asset level, and what they produce is topology with no meaning attached. Boxes and arrows tell you that two services talk. They do not tell you what they agreed to, or which of those agreements your next change breaks.
Today we are introducing the Software Map
The Software Map in Qodo is available in beta starting today.
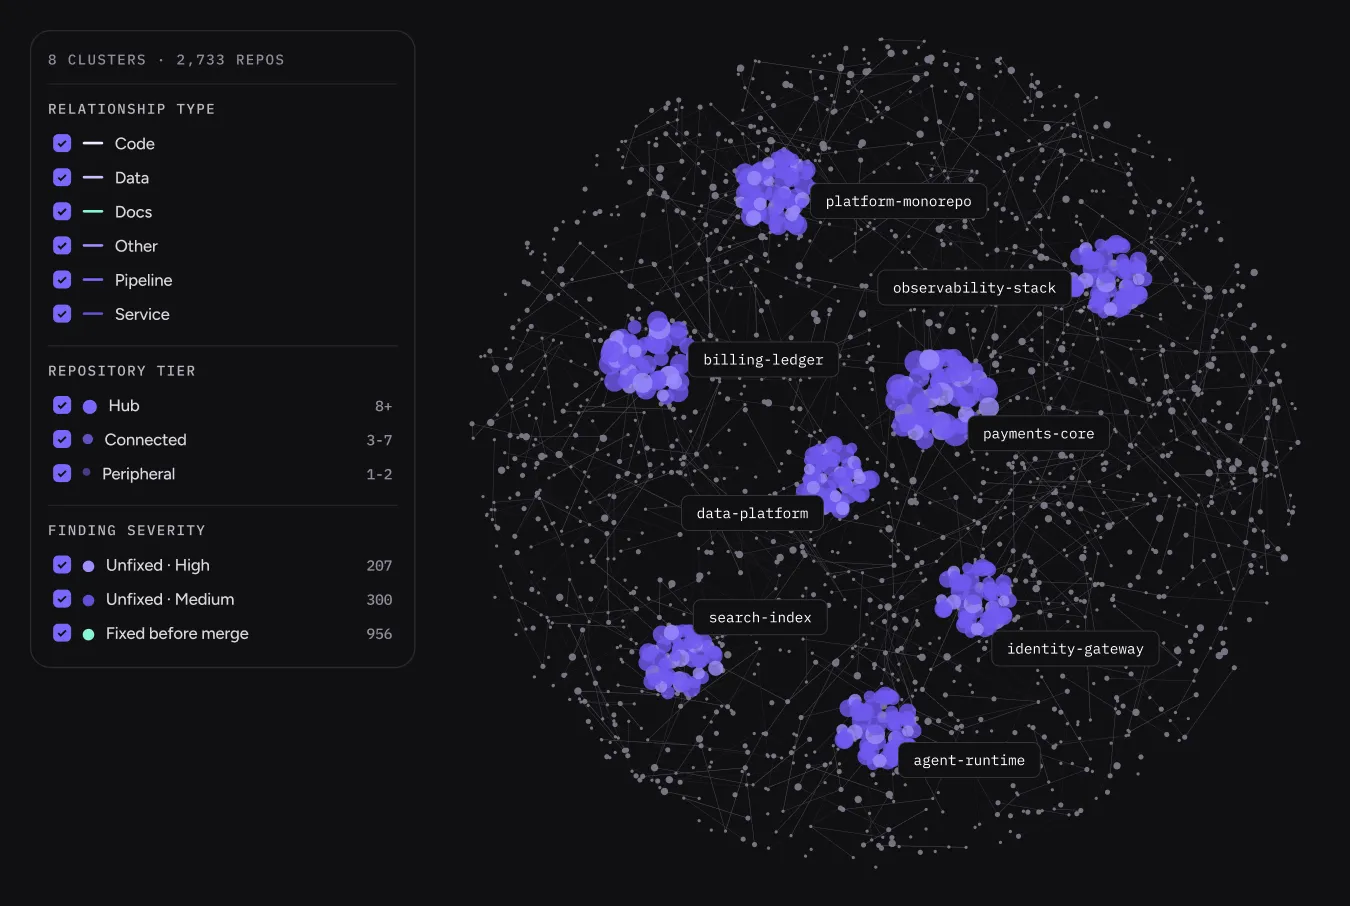
Qodo maps your software system across every repo, automatically, and keeps it current on every PR. Open it and you see:
- How your system is laid out. Which repos are central, which are peripheral, which are hubs that everything routes through. Surfaced without anyone configuring it.
- What a change will break. The blast radius of each repo, and the contracts between services that a change puts at risk.
- Where risk is piling up. Review findings as a heat map over the architecture, so quality problems have a location.
It works at the repo level, which is the level engineers actually work at. There is nothing to set up. Qodo automatically discovers your repos and builds the map. The first build takes a few hours, because agents are surveying the entire system, and after that it re-derives on every PR.
The map is interactive. Scope it to a team, filter to a service, follow a contract out to its consumers, narrow to findings that were flagged and never resolved.
Know the blast radius before you merge
Every engineer has shipped a change that looked contained and was not.
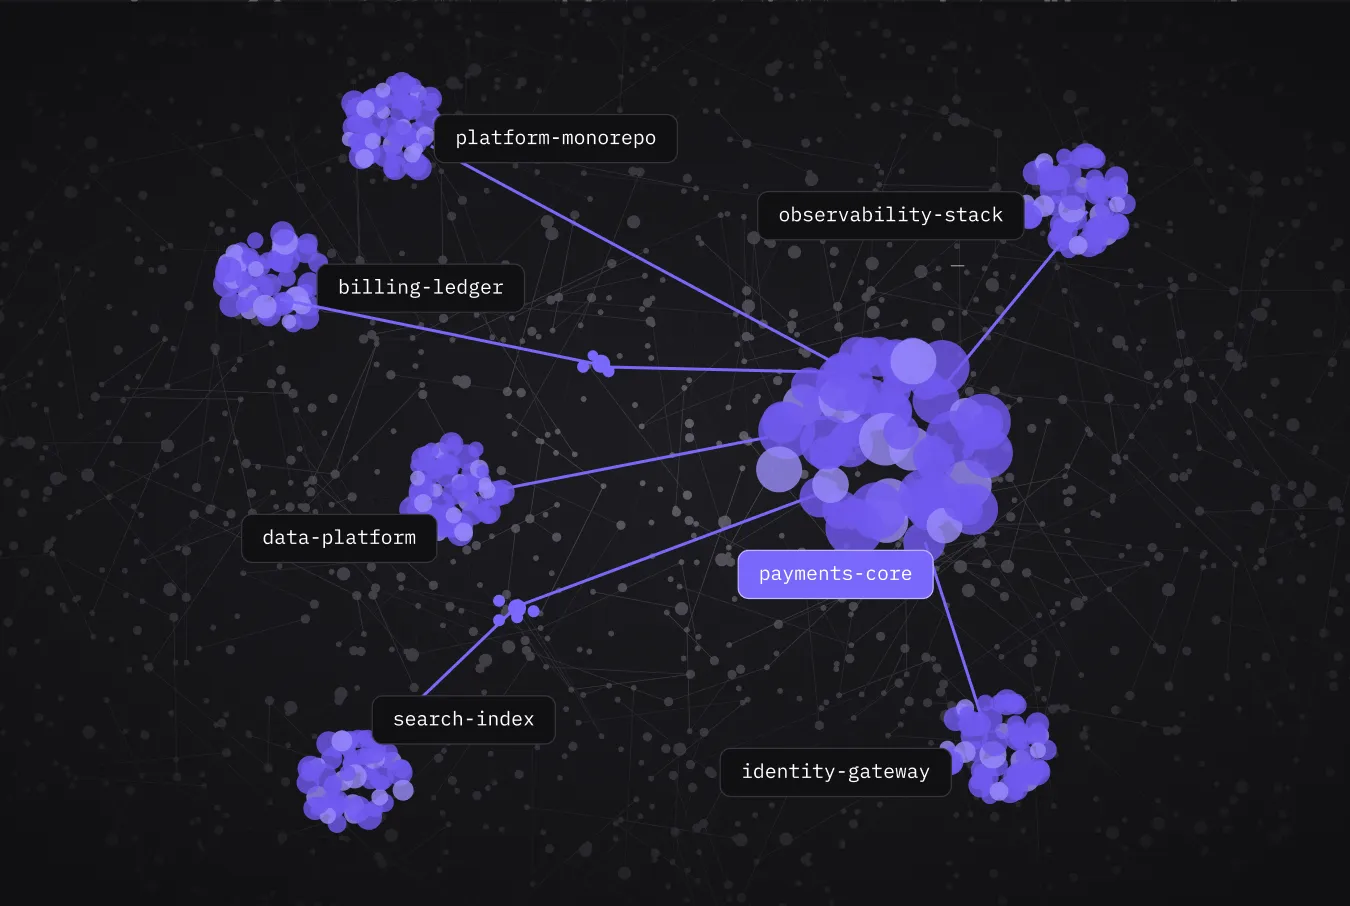
The map replaces the guess. Before writing a change, you see its full set of downstream dependents, so review scope and test scope can match real risk instead of intuition. Planning an API change or a deprecation, you see every consumer of that contract at once rather than discovering the seventh one in an incident channel.
What makes this hold up is that Qodo learns the contracts between services from the code and re-derives them as PRs land. The map reflects the system as it is today, not as it was when someone last remembered to update it. It runs today on systems large enough that a single repo carries 180 connections.
Quality becomes a location instead of a feeling
Most engineering leaders can tell you their code quality is slipping. Very few can point to where.
Qodo tracks both sides as they move. New connections and contracts appear on the map as PRs land, and review findings map onto that same architecture. Filter to issues that were flagged and never resolved and you get a ranked view of where debt is concentrating, which is a much better input to a technical debt conversation than the loudest opinion in the room.
It also gives leaders an honest way to see what AI is doing to their system. The parts taking the most findings are the parts where standards need to be tighter, and now that is a place on a map rather than a hunch.
A map you look at, or a map your agents work from
This is the difference that matters, and it is easy to miss in a screenshot.
Other system maps are diagrams. You look at them, you nod, you close the tab. This one is the context Qodo’s agents work from when they review your code. The same understanding of hubs, contracts, and downstream impact that you explore in the UI is what a review agent uses to decide whether a change is safe.
That makes it a governance surface as well as a picture. It closes the loop we have been building toward: the map informs review, review findings populate the map, and both stay current because the code is the source. It also means engineering and platform teams can finally see the context being served to the agents operating in their codebase.
We have said for a while that context is the hard part of software development. This is what solving it looks like at the system level.
Looking ahead
Today the heat map covers Qodo’s findings. Your reviewers’ findings come next, and that matters more than it sounds. Once both are on the map, you can see where your own team keeps flagging the same problem and nobody ever fixes it. Risk scoring on individual connections comes after that.
Worth naming what came before this. Cross repo review gave Qodo the ability to understand the relationship between two software entities and use it during review. The Software Map is the first full application of that capability. Instead of reasoning about repos pairwise, the whole system is visible at once, and that opens up analysis that was not possible before: hub identification, blast radius ranking, contract tracking, quality monitoring across the map.
The teams who can see their system will compound
I have watched this pattern play out before. Teams that invested in test culture early had a structural advantage over teams that tried to bolt it on at 200 engineers. Teams that standardized code review before scaling had better outcomes than teams that treated it as optional until it was not.
Visibility into the system is that decision now. AI is going to keep adding code, and it is going to keep adding architecture along with it. The organizations that can see their system as it is will govern it. The ones relying on three people and a stale diagram will keep finding out what their changes broke after they break.
About the author