11 Best DevOps Monitoring Tools in 2025

Modern software applications are getting more and more complex. As companies try to stay ahead of their competitors, they need to constantly monitor, analyze, and improve how they build and deliver software. DevOps monitoring tools have become a key part of this effort by empowering teams to navigate and tackle the challenges of modern software development more effectively.
What are DevOps monitoring tools?
DevOps monitoring tools allow organizations to gain the insight necessary for enhancing their software development and deployment processes. These tools enhance system observability, enabling teams to proactively identify issues, improve operational efficiency, and maintain high-quality software in production environments.
Why monitoring is crucial for DevOps
Real-time monitoring stands as a key part of effective DevOps practices, providing essential capabilities that directly impact organizational performance.
- Identifying performance bottlenecks: Detect and resolve system limitations that impact application speed and responsiveness.
- Tracking deployment status: Gaining granular visibility into each stage of the continuous integration and continuous deployment (CI/CD) pipeline.
- Assuring system reliability: Maintaining high availability and minimizing potential service failures.
The proactive monitoring approach offers substantial benefits:
- Early issue detection: Identifying and mitigating potential problems before they impact end users or system performance.
- Performance optimization: Continuous improvements to infrastructure and application capabilities based on data-driven insights.
- Operational efficiency: Minimizing downtime by enhancing overall system reliability through intelligent continuous inspections.
11 Best monitoring tools for DevOps in 2025
Now, let’s look into the best DevOps monitoring tools for 2025.
1. Dynatrace
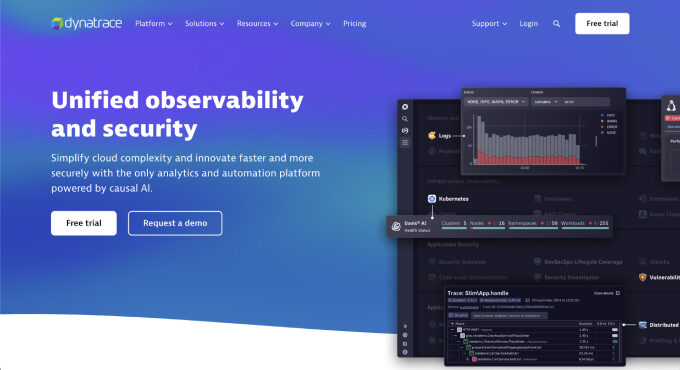
Dynatrace is an application performance management (APM) platform trusted by over 8,000 enterprises worldwide. It helps corporations manage advanced multicluster hybrid infrastructures, automatic dependency mapping, real-time performance tracking, and predictive AI analytics.
Key features:
- AI-powered automatic and intelligent observability.
- Full stack monitoring across applications, infrastructure, and cloud environments.
- Real-time performance and user experience tracking.
- Automatic root cause analysis.
- Predictive analytics and anomaly detection.
Best For: Large enterprises that require comprehensive, AI-driven monitoring across complex multi-cloud environments.
Pricing: Custom enterprise pricing with multiple tiers available. Free trial offered.
2. Prometheus
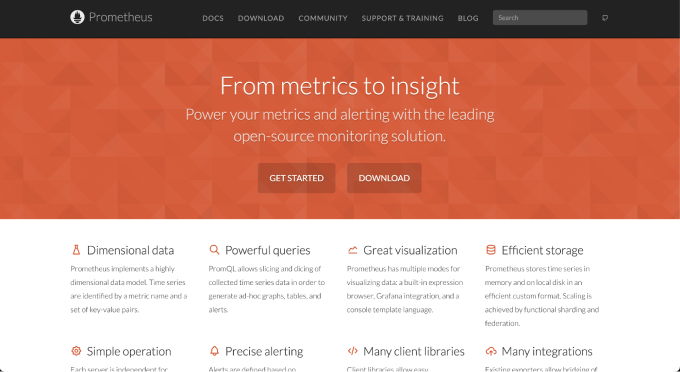
Prometheus has achieved great popularity with over 55K stars on GitHub and is one of the world’s most popular open-source monitoring solutions. Some companies using Prometheus include SoundCloud and Docker, and it is one of the core projects of the Cloud Native Computing Foundation. It specializes in gathering and analysis of time series data, making it suitable for supervising container-based architectures such as Kubernetes.
Key features:
- Powerful multi-dimensional data model.
- Flexible query language (PromQL).
- Efficient time series data collection.
- Integrated alerting management.
- Extensive service discovery mechanisms.
Best For: Organizations using microservices and containerized infrastructures while looking for a flexible monitoring solution.
Pricing: Open source and free, with optional commercial support available.
3. Datadog
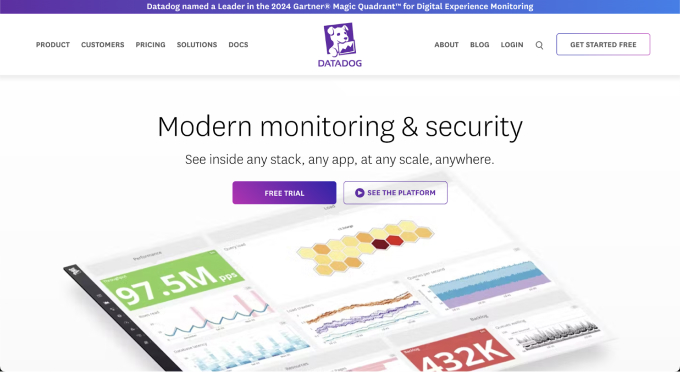
Datadog is a cloud monitoring platform offering end-to-end observability across multi-cloud and hybrid environments. It is equipped with over 800 predefined integrations that support linking infrastructure, applications, and business KPIs in order to enhance its support. This holistic approach helps organizations quickly troubleshoot issues, improve performance, and detect threats, ensuring their services remain reliable and available.
Key features:
- Comprehensive cloud infrastructure monitoring.
- Real-time performance metrics.
- Automated threat detection.
- Custom dashboards and visualizations.
- Multi-cloud and hybrid environment support.
Best For: Organizations looking for real-time observability and performance monitoring across multi-cloud and hybrid environments.
Pricing: Tiered pricing starts from $15 per host per month, with a free trial available.
4. New Relic
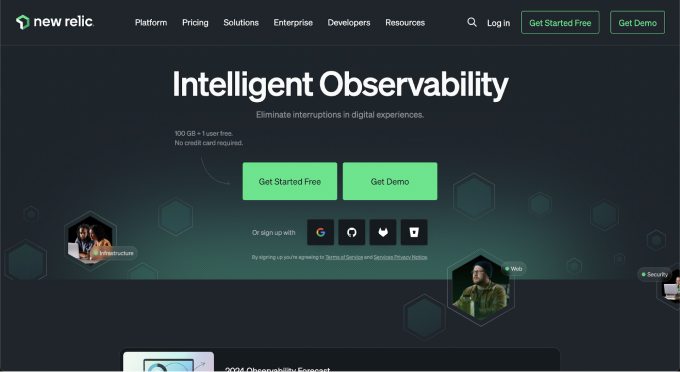
New Relic is an observability platform with more than 14,000 customers globally and is used by 50 of the Fortune 100 companies. New Relic provides a deeper view of application performance, insight, and business success by pivoting raw data into strategic intelligence.
Key features:
- Unified observability across the entire software stack.
- Real-time performance tracking.
- Distributed tracing.
- AI-powered insights.
- Comprehensive telemetry data management.
Best For: Enterprises looking for unified observability and insights into application performance and business outcomes.
Pricing: Offers three pricing models: Free, Pro, and Enterprise.
5. Grafana
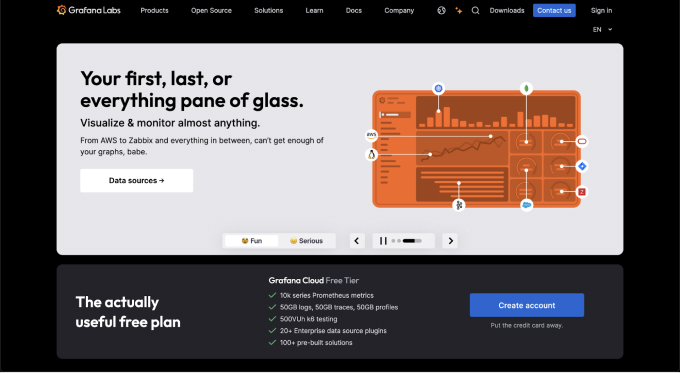
Grafana is a free and open-source software platform for creating dashboards and visualization for different types of data. It’s perfect for system management, performance metrics tracking, and insightful analysis. Grafana combines data from Prometheus, Elasticsearch, SQL databases, and many more so that the teams can better manage and comprehend their systems.
Key features:
- Multi-platform data visualization.
- Extensive plugin ecosystem.
- Advanced dashboard customization.
- Support for multiple data sources.
- Real-time monitoring capabilities.
Best For: Teams looking for sophisticated, customizable monitoring dashboards across diverse technological environments.
Pricing: Offers an open-source, free version with paid enterprise plans available.
6. Elastic Stack (ELK)
Elastic Stack is a powerful open-source platform for managing and analyzing logs and data. It includes Elasticsearch for searching and analyzing data, Logstash for data processing, and Kibana for visualizing data. Elastic Stack helps organizations monitor their systems, troubleshoot issues, and gain real-time insights into performance and security.
Key features:
- Centralized log management.
- Advanced search and analytics.
- Real-time data visualization.
- Scalable log processing.
- Security and compliance monitoring.
Best For: Organizations requiring scalable log analysis, real-time data visualization, and actionable security insights.
Pricing: Offers an open-source, free version with paid enterprise subscriptions.
7. Zabbix
Zabbix is an enterprise-level open-source monitoring solution that provides support for more than 6,000 companies. It simplifies IT infrastructure monitoring with a comprehensive feature set and flexible scalability.
Key features:
- Comprehensive network and application monitoring.
- Auto-discovery of IT resources.
- Event alerting.
- Advanced reporting.
- Multi-platform support.
Best For: Mid to large-scale enterprises requiring flexible, scalable monitoring solutions.
Pricing: Offers an open-source version with commercial support options.
8. AppDynamics
AppDynamics is an application performance management platform owned by Cisco. It allows organizations to actively monitor application performance, user interactions, and business goals. AppDynamics also supports aligning technical performance with strategic business goals, ensuring that digital experiences meet user expectations.
Key features:
- End-to-end application performance tracking.
- Business transaction monitoring.
- Real-time user experience insights.
- Automatic performance baselines.
- Machine learning-based anomaly detection.
Best For: Enterprises requiring deep application performance and user experience insights.
Pricing: Enterprise-level subscription with custom pricing.
9. Nagios
Nagios is an event-monitoring application with over a million users around the world. Thanks to its modular architecture, companies can customize the services to their own business requirements, providing consistency and adaptability for complicated infrastructures.
Key features:
- Comprehensive infrastructure monitoring.
- Customizable plugin architecture.
- Performance graphing.
- Multi-platform support.
- Detailed alerting mechanisms.
Best For: Organizations with complex IT infrastructures that need detailed monitoring and customizable plugin-based solutions.
Pricing: The open-source version is free, with paid enterprise editions available.
10. Splunk
Splunk is a CISCO-owned enterprise platform that provides security, observability, and real-time analytics. In addition to monitoring, Splunk serves as a data transformation engine that turns organizational data into actionable insights.
Key features:
- Advanced log management.
- Security information and event monitoring.
- Real-time threat detection.
- Machine learning-based insights.
- Comprehensive data integration.
Best For: Large enterprises seeking advanced operational intelligence and security monitoring in large-scale, data-intensive environments.
Pricing: Enterprise-level subscription with custom pricing is available upon request.
11. PagerDuty
PagerDuty is an incident management platform that helps organizations quickly address and resolve critical issues. It provides real-time alerts, automated escalation, and on-call scheduling to ensure the right team members are informed and can take action promptly.
Key features:
- Real-time incident alerting.
- Automated escalation policies.
- On-call scheduling.
- Machine learning powered insights.
- Comprehensive integration capabilities.
Best For: Teams needing real-time incident response and management workflows in time-critical environments.
Pricing: A tiered subscription model with a free trial.
Wrapping up
DevOps monitoring tools have become critical strategic assets in modern software development as they provide an upfront view of infrastructure, applications, and processes. The tools highlighted in this list help teams track key metrics, spot performance issues, improve efficiency, and support continuous integration and delivery.
From AI-powered solutions like Dynatrace to open-source alternatives like Prometheus, the monitoring tools covered in this article offer diverse capabilities that transform raw technical data into strategic business insights. With real-time analytics, automated alerting, and deep performance tracking, these tools help organizations ensure operational excellence, minimize downtime, and create continuous improvement within their software delivery pipelines.