Top 5 SonarQube Alternatives in 2026
TL;DR
- SonarQube is effective for rule-based checks: code smells, style violations, and known security patterns, but feedback arrives after code is pushed or during CI. That timing creates fix-and-repush cycles that slow delivery, especially in multi-service codebases where changes span shared contracts and downstream consumers.
- Enterprise changes rarely stay isolated to one file. Updates to shared DTOs, APIs, or utilities impact downstream services in ways that file-level analysis does not capture. A required field added to a shared DTO passes every per-file check and breaks a consuming service at runtime.
- Teams run SonarQube alongside specialized tools because each catches a category of failure the others do not reach. Snyk Code traces dependency-level security vulnerabilities. Qodo’s code review brings up behavioral mismatches, cross-file inconsistencies, and workflow impact before code is pushed, fixing issues in the same session they are written, not after a CI cycle.
SonarQube handles rule-based issues reliably, but feedback reaches developers only after CI runs, not while code is being written. Once changes span multiple services, each CI failure requires reloading context from a different repo, coordinating with another team, and re-running pipelines; each round adds hours.
The scale of usage around Visual Studio Code explains why this is important. 82% of developers use AI coding tools daily or weekly, and only 28% are confident in the code those tools create. (Qodo Report).
Most AI-generated code takes its final shape in the editor, before any CI check runs, so rule-based tools that wait for a push never see the decisions made at authoring time.
In multi-service codebases, a change to a shared module propagates to every consumer, and file-level analysis has no visibility into those consumers’ expectations.
When a DTO gains a required field, file-level analysis confirms each file is individually valid, but it has no visibility into which consuming services read that DTO and whether they handle the new field. The mismatch surfaces at runtime, not at review.
Qodo runs a review-quality analysis on the local diff before push, surfacing the same categories of feedback a senior reviewer would raise: behavioral mismatches, pattern inconsistencies, and missing edge cases. Instead of waiting for a pipeline, you get feedback tied to how the change behaves in the repository.
This article looks at 5 SonarQube alternatives based on how they behave in real codebases. We’ll start by outlining how SonarQube is typically used in workflows, then go deeper into each tool, beginning with Qodo.
Why do teams add tools when SonarQube’s CI feedback loop slows cross-service development?
Teams add tools when the CI feedback loop creates friction. SonarQube wasn’t made to be eliminated. The shift shows up in how code is written, reviewed, and maintained across services.
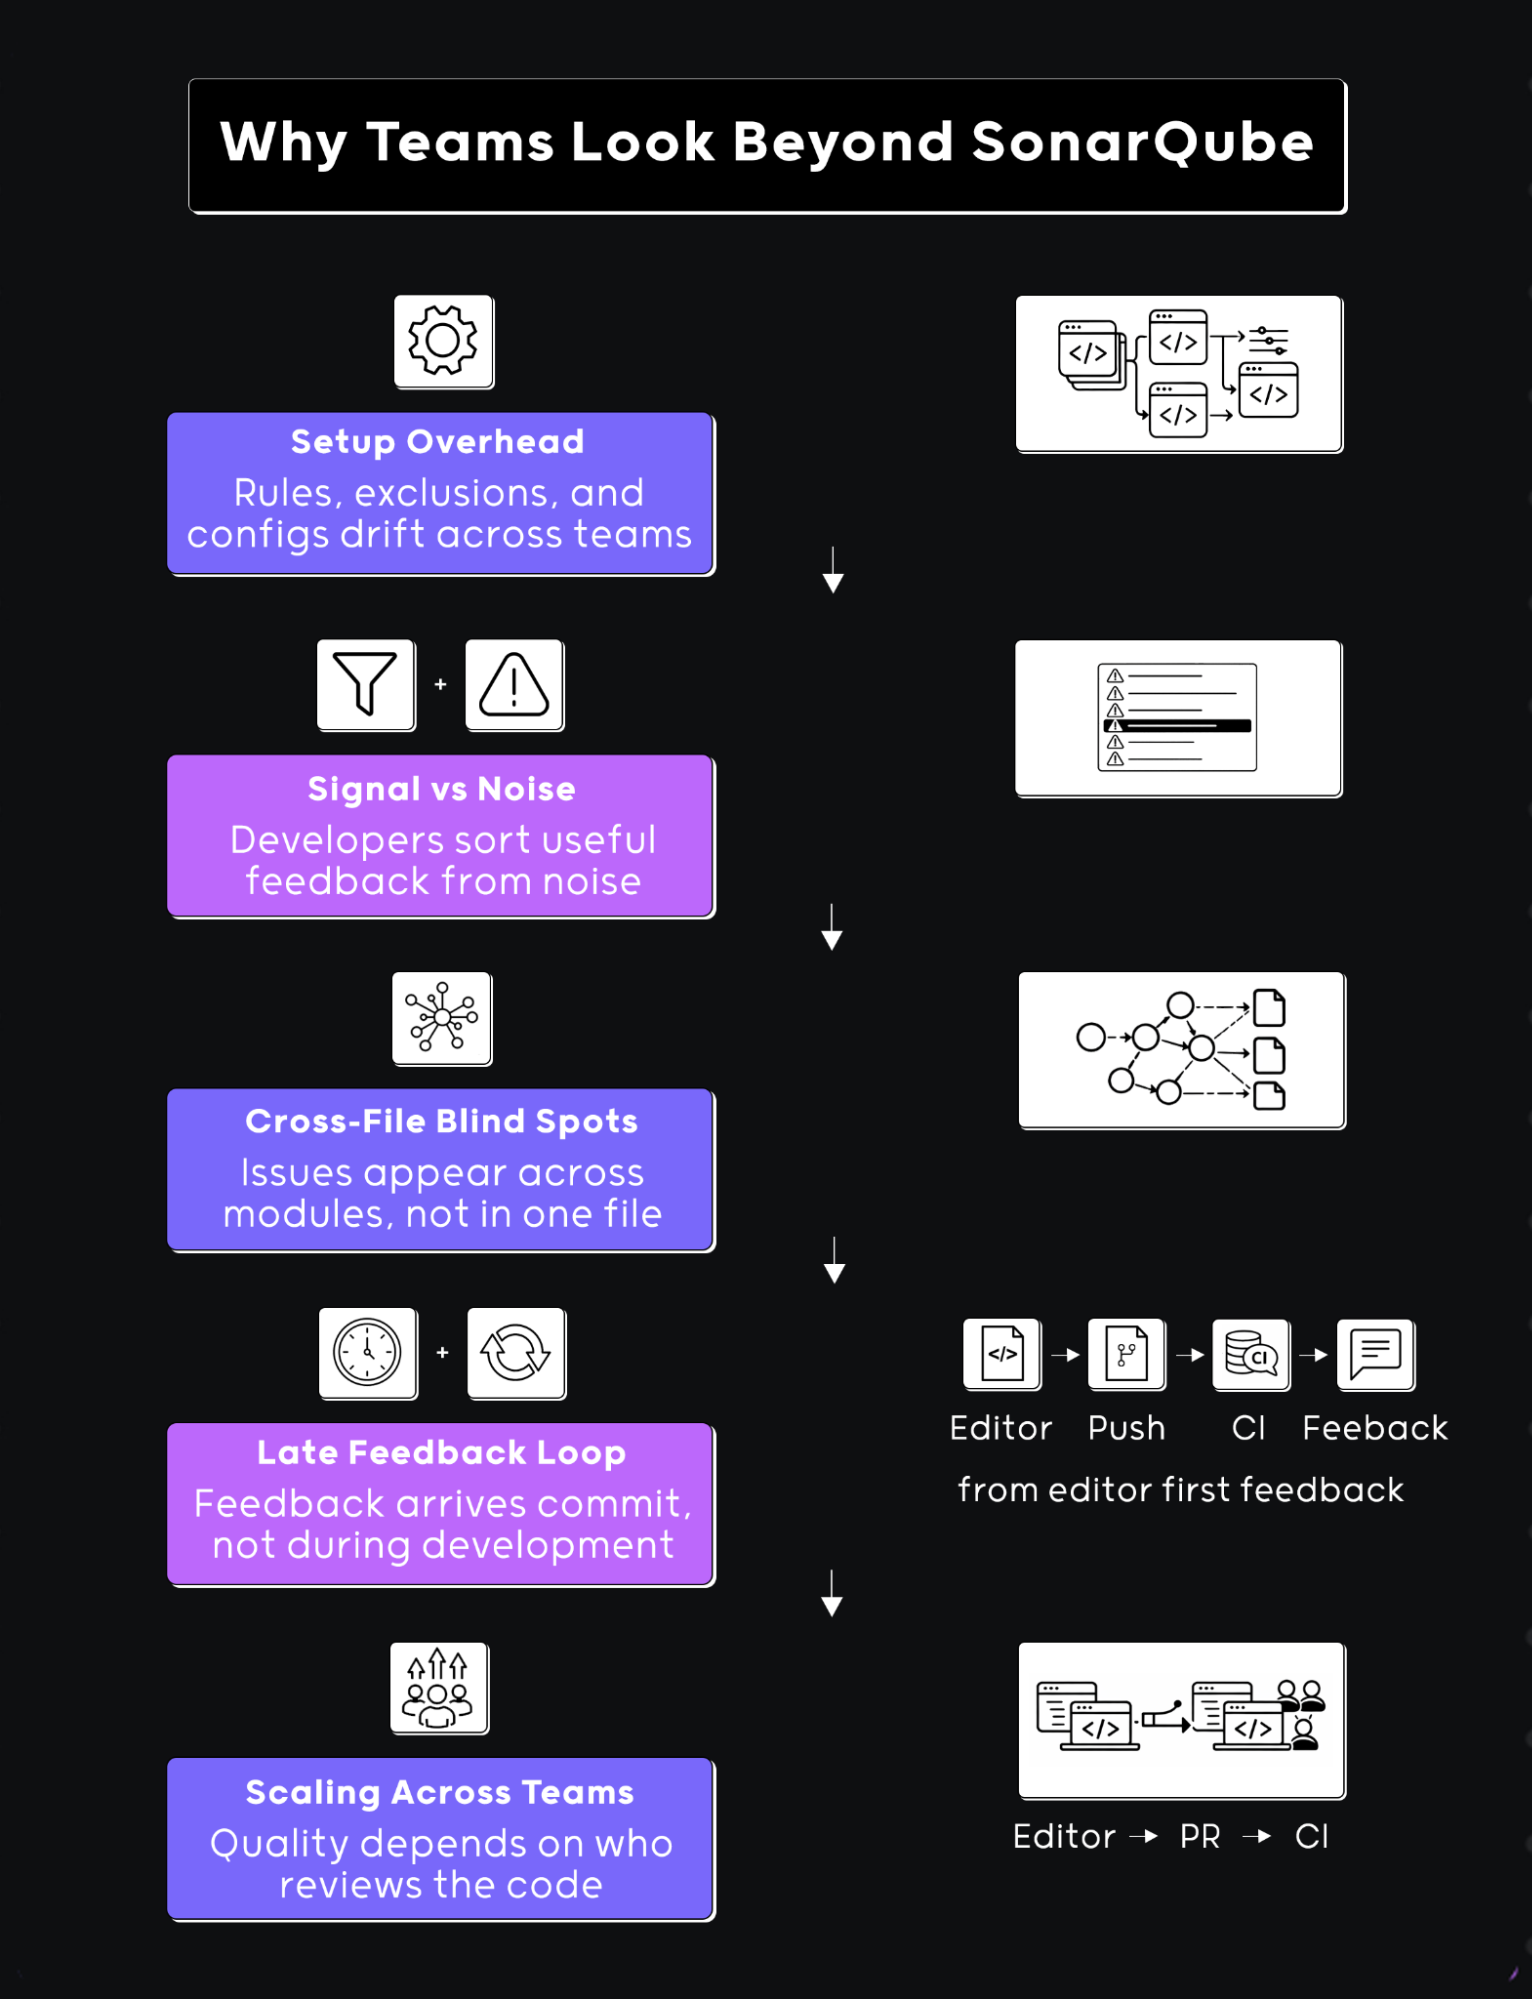
Setup and Maintenance in Large Repositories
In smaller projects, SonarQube setup is straightforward. In larger systems, it often involves keeping up with rule sets, exclusions, and project-level configurations across multiple repos.
I’ve seen cases where one team tunes rules for backend services, another adjusts them for frontend code, and over time, the configurations drift. When a new repo is added, someone has to decide which rules apply and how strict they should be.
Rule drift doesn’t block deployments, but every new repo forces someone to audit which rules apply, configure exclusions, and test the setup. When that work is skipped, teams ship with misconfigured rules, either missing checks that should fire or noisy checks that developers learn to ignore
When CI returns 20 warnings, and only 3 apply to your change
SonarQube flags known violations reliably. The gap is timing: results arrive after push, so a developer who has moved to the next task has to reload context, re-open the change, and fix something they wrote hours ago.
A developer pushes a change and CI returns 20 warnings: 3 are relevant to the diff, 12 are pre-existing style violations in untouched files, and 5 were suppressed last quarter when the team disabled a rule that generated too much noise. The developer opens the CI report, reads through all 20 warnings, marks 17 as pre-existing or suppressed, and fixes the 3 that relate to their diff, after already switching to the next task and reloading context from a different branch.
Teams suppress noisy rules to keep CI output readable, but each suppression removes a check permanently. When a rule covering error-handling patterns is suppressed, raw stack traces start shipping to consumers expecting structured errors, and the mismatch surfaces in integration testing rather than during review. Over time, teams tune rules down or suppress entire check categories to keep CI output manageable, which means some violations stop being caught at all.
File-Level Analysis Misses Cross-Service Contract Violations and They Come Up at Runtime
A common pattern in real codebases is a change that touches more than one place. Updating a shared interface, modifying a utility, or changing a response structure often affects multiple modules.
In one case, a change to a shared DTO added a required field with no default. SonarQube’s per-file analysis confirmed each file compiled and matched its rules, but no check evaluated whether the consuming service was updated to handle the new required field.
The consuming service failed at runtime when it received records that predated the new field; the failure surfaced in integration testing, not during review.
File-level and rule-based tools handle local correctness well. Teams add tools when a change passes every check but breaks a downstream consumer because a contract assumption, the shape of a response, the presence of a field, or the format of an error is not enforced by any single file’s rules.
Pro tip: Use Qodo for cross-file impact
At Monday.com, Qodo prevents an average of 800 potential issues from reaching production every month while saving developers approximately one hour per pull request. Here are of the ways Qodo can be used for cross-file impacts in enterprises:
- Run /review on any change that touches shared contracts (DTOs, APIs, utilities). Qodo follows how that change propagates across the repo, not just the file you edited.
- Use it when modifying interfaces or response shapes. It flags mismatches between producers and consumers early, before another service breaks.
- Pay attention to grouped feedback. If the same pattern shows up in multiple files, fix it consistently instead of patching one location.
- Treat its output like a pre-PR review. If Qodo raises a behavioral or consistency issue, it’s likely something a reviewer or integration test would catch later.
- Combine it with your existing static checks. Let rule-based tools handle syntax and known patterns, and use Qodo to validate how the change behaves across modules and services.
1. Qodo (AI Code Review Platform)
Qodo’s Context Engine analyzes the full diff, what was added, removed, and modified, alongside surrounding repository context, existing implementation patterns, and related logic across the codebase, indexing 10 repos or 1,000.
The Review Agent Suite deploys specialized agents, for critical issues, duplicated logic, ticket compliance, rules enforcement, and breaking changes, analyzing the full diff in context rather than file by file, so contract violations between services are caught before merge, not during integration testing.
For example, updating a condition inside a function did not pass silently. The review flagged missing edge cases, identified inconsistent handling compared to similar logic elsewhere in the repository, and generated agentic suggestions tied to existing implementation patterns. Combined with PR memory and Qodo’s rule system, the Review Agent Suite evaluates whether a change matches the error-handling patterns, naming conventions, and validation logic already used elsewhere in the repo.
Best Fit
Qodo is the right fit for enterprise teams shipping AI-generated code across multiple repositories where cross-service contract violations, deployment ordering risks, and organizational rule consistency are primary concerns. Qodo prevents an average of 800 potential issues from reaching production every month at monday.com while saving approximately one hour per pull request.
Hands on: Accessibility Review in Real Code
I ran Qodo on a UI change that looked fine at a glance, a form update with a few new fields. Normally, this is the kind of thing that passes local checks and only gets proper scrutiny during PR review or accessibility audits.
How Qodo catches a missing screen-reader label that SonarQube’s accessibility rules would pass: Instead of generic warnings, Qodo responded like a reviewer reading the diff. It pointed directly to label-control association issues, specifically missing htmlFor on labels and missing id on corresponding inputs.
The flag itself was secondary, Qodo explained exactly how the missing label breaks screen-reader navigation for users relying on assistive technology, the kind of context a senior front-end reviewer would add, not a linter.
It called out that the * used for required fields was only visual, and screen readers wouldn’t interpret it correctly. That’s the kind of comment I’ve seen come from experienced front-end reviewers, not static rules.
The review didn’t stop at a single instance. It grouped issues across multiple files, the form component and a chart control component, and showed the same pattern repeating. Instead of isolated warnings, it connected them as a consistency problem across the UI layer.
In a typical SonarQube setup, you might get accessibility warnings if rules are configured, but they tend to be line-level. Here, the feedback read like, “this pattern is wrong in multiple places, fix it consistently.”
Surfacing PR-blocking issues before push means they’re fixed in minutes, not after a review cycle: What changed the workflow was how Qodo framed the feedback. It explicitly said these issues would come up during the PR review. Knowing an issue will block merge means fixing it now, in context, rather than treating it as an optional cleanup item after push. You’re not just resolving a lint error, you’re solving something that would block a merge later.
From a workflow perspective, this shifts when these problems are handled. Normally, accessibility issues like this either slip through or come back after someone reviews the UI carefully.
Here, they showed up while I was still working on the change. Fixing them took a few minutes, adding htmlFor, matching id attributes, and replacing the visual-only * with screen-reader-readable markup, and eliminated a round-trip review cycle that would have added a day to the PR.
SonarQube flags a violation after the commit is pushed and CI runs. Qodo brings the same category of issue while the diff is still open, before context is lost and before a repush cycle begins. SonarQube catches defined accessibility violations when the relevant rules are enabled.
Qodo surfaces the same violations in the context of the active diff, explains how they affect users, and groups them by pattern across files, the way a reviewer would structure the feedback.
Pros
- Surfaces review-level issues before PR
- Follows context across files and modules
- Aligns with how reviewers actually evaluate changes
- Groups issues clearly by severity
Cons
- Needs some setup to match repo conventions
- Feedback can be dense on older codebases
Qodo solves behavioral correctness and cross-file consistency. Snyk Code covers a separate layer, dependency chains and data flow vulnerabilities that rule-based static analysis doesn’t trace. For teams running both, Snyk handles security depth; Qodo handles review quality.
2. Snyk Code
SQL injection, path traversal, and HTTP header injection vulnerabilities rarely look like obvious bugs, they look like normal input handling until data reaches an unsafe call site. Snyk Code focuses on how data moves through the code rather than just checking patterns in isolation. It fits into workflows where security checks are expected to run alongside development, not just in a later stage.
Snyk Code analyzes code as you write or commit, looking for known vulnerability patterns. The difference is in how it evaluates risk, it doesn’t just match syntax, it considers how inputs are handled and where they end up.
For example, handling user input in an API layer may look fine in one function. The tool traces whether that input flows into database queries or external calls without proper validation. The issue isn’t always in a single line, it’s in how the code behaves end to end.
Hands on: Security Analysis Inside the Editor
I ran Snyk Code on a Python project using Django with dependencies defined in requirements.txt. The code itself didn’t raise obvious concerns during development, which is usually where dependency-level issues remain unnoticed until later stages.
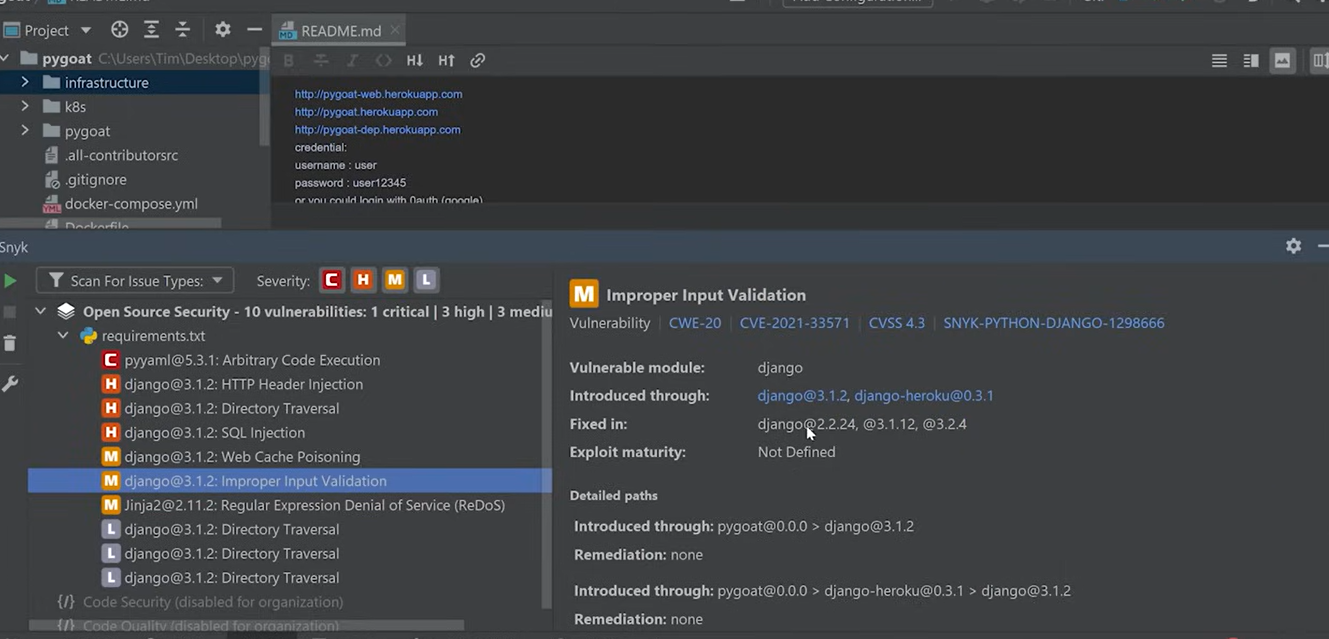
How Snyk surfaces a critical Django SQL injection vulnerability hidden three dependency levels deep: The scan surfaced multiple vulnerabilities tied to dependencies, including HTTP header injection, SQL injection, directory traversal, and improper input validation. Each issue was mapped to the exact package and version in use.
The output also included references like CWE and CVE identifiers, along with severity levels. Issues were grouped by critical, high, and medium, which made it easier to understand priority without going through raw logs.
How Snyk traces a Django vulnerability through intermediate dependencies to the affected package: Selecting a specific issue showed how it entered the project. For example, a vulnerability in Django was traced through intermediate dependencies, showing the full path from the project to the affected package.
It also listed which versions contained fixes. In reality, resolving the issue involved updating the dependency version or replacing it if no fix was available.
This type of feedback typically appears during CI security scans or external audits. Here, it was available inside the editor while working on the code. Snyk Code focuses on dependency chains and data flow vulnerabilities. Qodo focuses on behavioral correctness, cross-service consistency, and review-quality feedback: two different layers and teams often run both.
Pros
- Detects security issues during development
- Tracks data flow across functions and modules
- Provides clear explanations with suggested fixes
- Aligns with CI-based security checks
Cons
- Requires setup and account integration
- Focused on security scope rather than general code quality
3. DeepSource
DeepSource runs static analysis on every commit, surfacing findings as part of the pull request workflow. It analyzes code with every change pushed to the repository. Feedback appears alongside commits rather than being triggered manually or scheduled separately.
The suggestions can be applied directly, which reduces manual effort for repetitive corrections. DeepSource integrates with version control systems and shows findings directly in pull requests. Issues are mapped to specific lines, similar to review comments. This keeps analysis results within the same place where code review happens, without introducing a separate feedback channel.
Hands on: Constant Code Analysis Over Time
Instead of looking at a single scan result, DeepSource presents code quality as something that evolves with every commit. I used it on an active repository to see how issues were tracked over time rather than at one checkpoint.
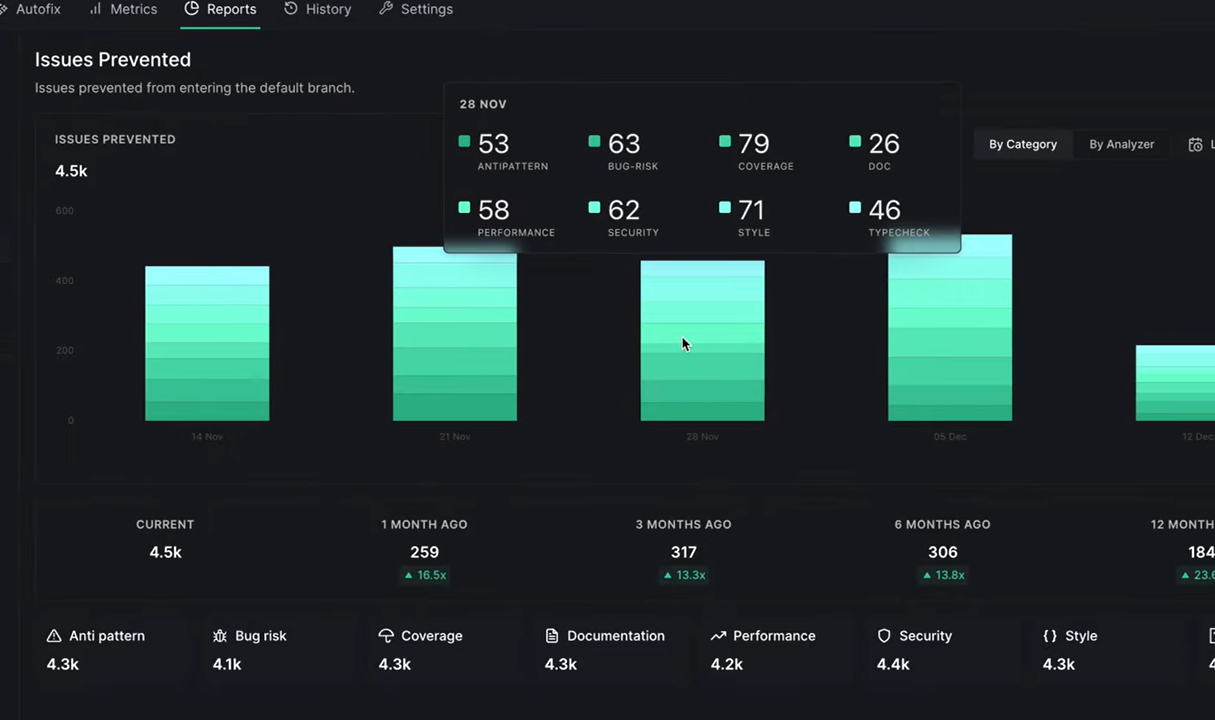
How DeepSource shows whether bug-risk and security violations are increasing or decreasing per commit: The report grouped issues into categories like anti-patterns, bug risk, performance, security, and style. Each category had a count tied to how many issues were prevented before reaching the default branch.
The view was less about individual warnings and more about distribution. You could see which categories contributed most to the overall issue count, which helps in identifying where the codebase needs attention.
It also showed historical snapshots, one month, three months, six months, with counts and relative changes. That gives a running view of whether issue volume is increasing or decreasing as the codebase grows.
Measuring how many issues are prevented before merge, not just detected after the fact: The report focused on issues prevented rather than just issues detected. That shifts the perspective slightly toward how often problems are caught before merge.
Each time window included counts along with percentage changes, which helps compare how the repository is trending over time. For teams working across multiple contributors, this provides a shared view of code quality without going into individual diffs.
Compared to SonarQube, where analysis is typically tied to scans or pipeline runs, this view is centered on constant tracking across commits.
Pros
- Constant analysis tied to commits
- Suggested fixes for common issues
- Pull request integration
- Supports multiple languages
Cons
- Requires configuration to manage volume of findings
- Limited visibility into broader system context beyond analyzed files
4. Codacy
Codacy aggregates results from multiple static analysis tools into a single interface, useful in mixed-language repositories where configuring each linter separately would fragment findings across different dashboards.
Codacy relies on a combination of underlying linters and rule engines. Instead of defining a single analysis model, it pulls results from these tools and standardizes how they are reported.
This allows teams to apply language-specific checks across different parts of the codebase without configuring each tool separately. Codacy integrates with repositories and CI pipelines, and surfaces findings directly in pull requests. Issues are annotated at the line level with severity indicators.
Hands on: Multi-Tool Code Analysis in One Place
To test Codacy, I ran it on a small PHP project with basic authentication flows and a central security.php handling headers and sessions. The code looked standard, nothing obviously broken, which is usually where mixed security and quality issues start to show up.
Unified Security Findings Across Tools: The analysis combined results across different categories instead of relying on a single rule set. It flagged issues like missing CSRF protection, incomplete security headers, and weak cookie configurations.
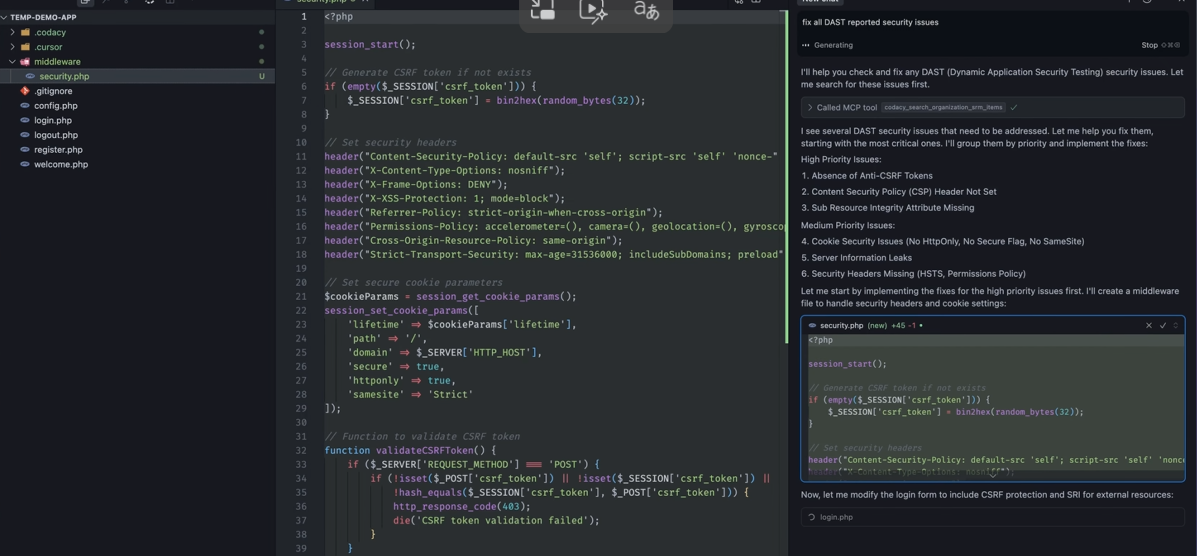
The output grouped findings by priority and listed them in a structured way. For example, it highlighted absence of anti-CSRF tokens, missing CSP headers, and cookie settings without HttpOnly or SameSite. Everything was visible in one place without switching between separate tools.
How Codacy shows exactly which cookie attributes to add, inline with the session code that needs them: The tool suggested changes directly alongside the code. In security.php, it proposed adding CSRF token handling, updating security headers, and tightening cookie parameters.
The fixes were shown inline, so it was easy to compare what needed to change. For example, adding secure, httponly, and samesite attributes to cookies was suggested exactly where session settings were defined.
Codacy aggregates linter outputs. Qodo’s Context Engine reads the diff against full codebase context, existing patterns, PR history, and cross-repo dependencies across 10 repos or 1,000, and surfaces what a reviewer would raise, not what a linter would flag. Rules in Qodo capture organizational standards and feed every review; the review, in turn, informs which rules to evolve.
Pros
- Supports multiple languages and rule engines
- Centralizes output from different analyzers
- Pull request integration
- Works across varied tech stacks
Cons
- Requires tuning to manage volume and relevance of issues
- Dependent on underlying tools for accuracy and depth
5. Semgrep
Semgrep takes a different approach to static analysis compared to traditional tools. Instead of relying only on predefined rule sets, it allows teams to define patterns that match how their codebase is actually written.
It scans code for security issues, bugs, and policy violations using pattern-based rules that can be customized. These rules are readable and can be adjusted to match internal conventions, which is useful when standard rules don’t fully capture how a system behaves.
The analysis runs locally, in CI, or as part of repository workflows. Findings are tied to specific code patterns, and rules can be extended over time as new issues are identified. This makes it adaptable to different codebases without requiring a full platform setup.
Hands on: Pattern-Based Security Detection in Real Code
To test Semgrep, I ran it on a Node.js project using Express and Sequelize, with a few routes handling user input and database queries. The code itself looked standard, typical request handlers and query execution, nothing that would immediately raise concern during development.
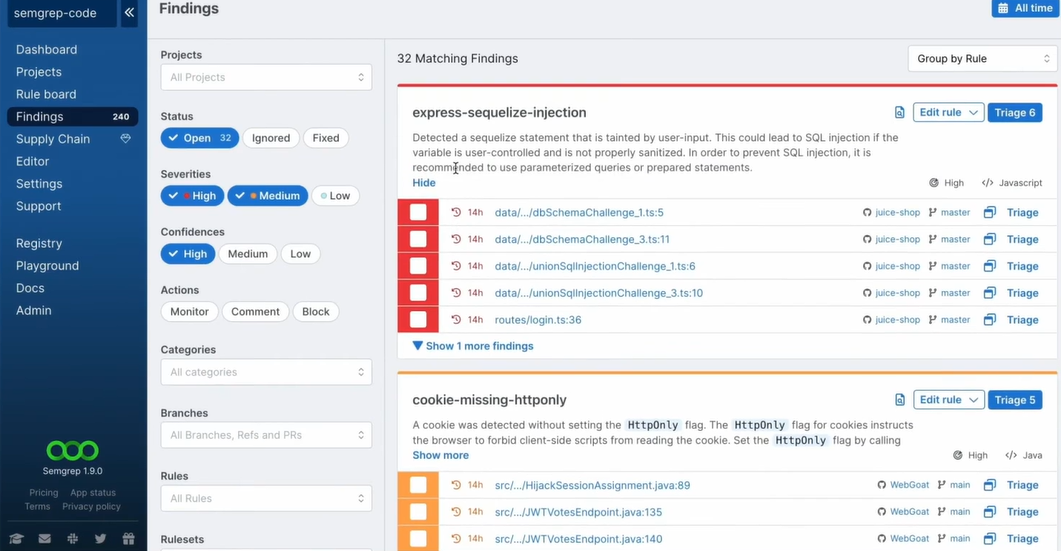
How Semgrep flags unsanitized Sequelize input and missing HttpOnly cookies using custom pattern rules: The scan surfaced multiple findings grouped by rules, such as express-sequelize-injection and cookie-missing-httponly. Instead of pointing to generic vulnerabilities, it mapped each issue to a specific pattern.
For example, it flagged SQL injection risks where user-controlled input was passed into Sequelize queries without proper sanitization. It didn’t just highlight the line, it explained why the pattern was unsafe and suggested using parameterized queries or prepared statements.
Similarly, it identified cookies missing the HttpOnly flag across multiple files. These were grouped under a single rule, showing how the same issue appeared in different parts of the codebase.
Why organizing findings by rule instead of file lets you fix an injection pattern once across all affected routes: The findings were organized by rule rather than file. That made it easier to see how widespread a specific issue was. For instance, the injection-related rule showed multiple occurrences across routes and services. Instead of reviewing each file separately, you could solve the pattern once and apply the fix consistently across all affected locations.
Compared to SonarQube, which relies on predefined rule sets and scan results, Semgrep’s approach centers on pattern matching. The findings depend on the rules being used, and those rules can be extended to match how the codebase is written.
Pros
- Custom rule creation based on code patterns
- Works across multiple languages
- Runs locally and in CI
- Suitable for enforcing internal coding policies
Cons
- Effectiveness depends on rule quality
- Limited understanding of broader system context
- Requires ongoing rule maintenance
Semgrep’s pattern rules enforce what teams manually define. Qodo’s Rules System auto-discovers standards from PR history and codebase patterns, then manages rule lifecycle, discovering, measuring adoption, and evolving rules as the codebase changes, without requiring manual authoring. The distinction: Semgrep requires ongoing manual rule authoring; Qodo’s rules evolve with the codebase.
Which SonarQube Alternative Fits Which Team?
| Team Profile | Best Fit | Primary Reason |
|---|---|---|
| Enterprise multi-repo org, AI-generated code, cross-service contracts | Qodo | Cross-file behavioral analysis, auto-discovered rules, deployment risk detection |
| Security-focused team needing dependency and data flow tracing | Snyk Code | CVE-mapped findings, dependency chain visibility, data flow analysis |
| Team wanting commit-level quality trend tracking | DeepSource | Historical issue trend view, issues-prevented metric, commit-level integration |
| Mixed-language repo needing centralized linter output | Codacy | Multi-linter aggregation, inline fix suggestions, unified dashboard |
| Team with capacity to author custom enforcement patterns | Semgrep | Custom rule creation, rule-organized findings, local and CI execution |
Beyond SonarQube: What enterprise teams add to close the AI code quality gap?
In larger teams, the bottleneck isn’t writing code, it’s what happens between commit and merge. Reviews come back with the same categories of feedback, CI runs confirm what reviewers already pointed out, and small issues move back and forth across multiple cycles. I ran Qodo locally on a change that introduced a new reporting endpoint and some schema updates to see how much of that loop could be handled earlier.
Qodo has 2M+ installations and 4M+ PRs reviewed every year. It is ranked #1 for Code Understanding in Gartner’s 2025 Critical Capabilities for AI Code Assistants.
On Gartner Peer Insights, 94% of Qodo users are willing to recommend the platform, compared to 56% for CodeRabbit (Gartner Peer Insights). CodeRabbit was not selected to participate in Gartner Critical Capabilities or the Magic Quadrant.
Gartner does not endorse any vendor, product or service depicted in its research publications, and does not advise technology users to select only those vendors with the highest ratings or other designation. Gartner research publications consist of the opinions of Gartner’s research organization and should not be construed as statements of fact. Gartner disclaims all warranties, expressed or implied, with respect to this research, including any warranties of merchantability or fitness for a particular purpose.
The output didn’t look like a static scan. It reads like a reviewer walking through the diff. It called out behavioral changes, flagged runtime risks tied to existing data, and explained how the new endpoint could show unexpected values depending on older records. These aren’t syntax issues, they’re the kind of comments that usually show up late in review when someone traces through actual usage.
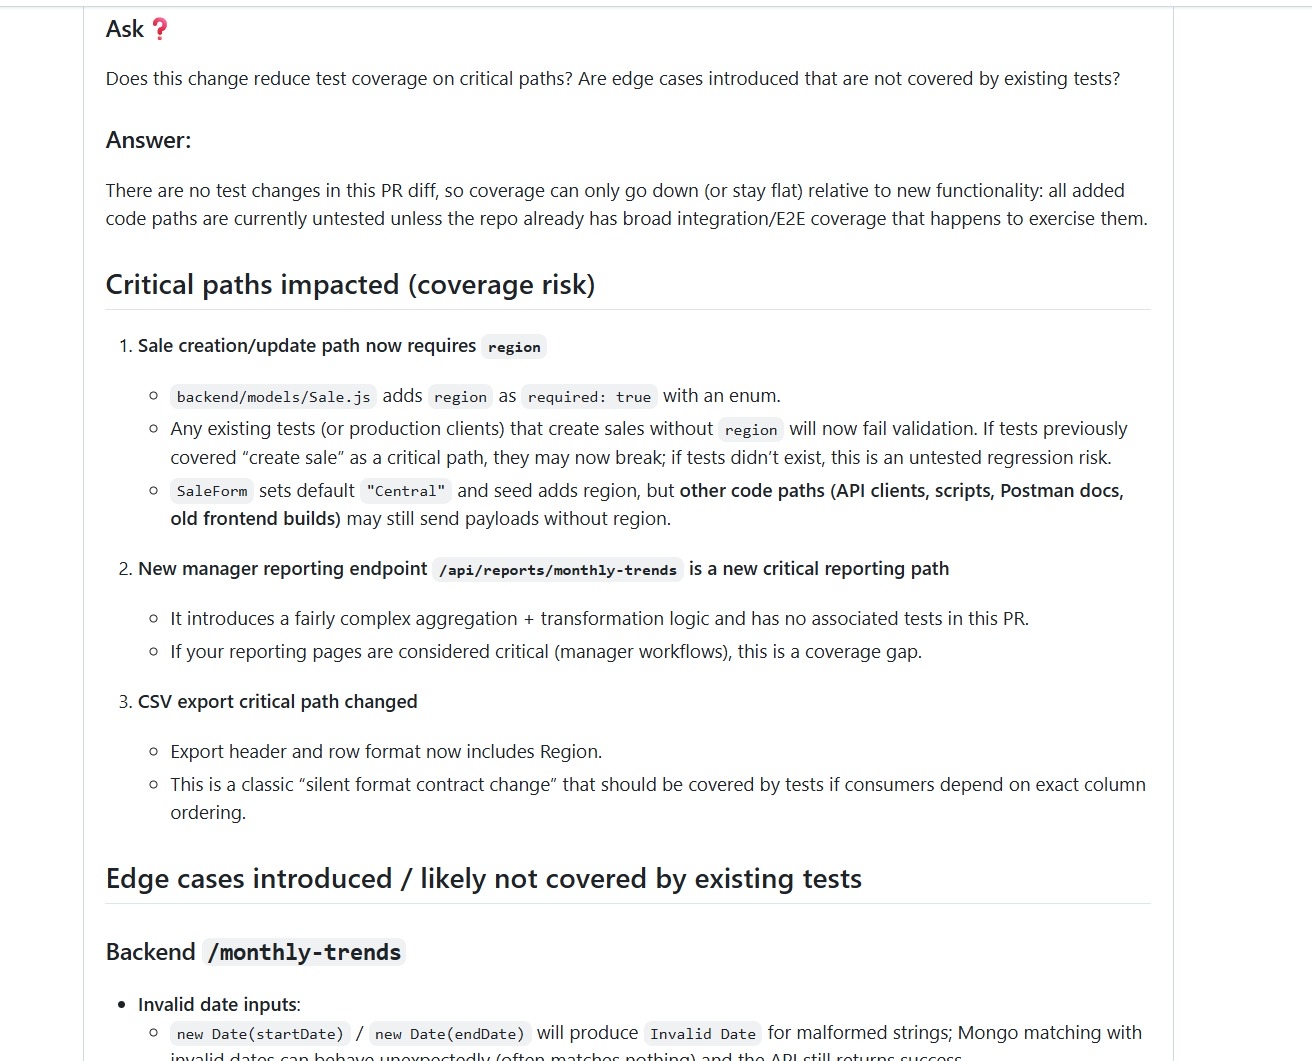
Qodo Flags Required-Field Validation Failures on Existing Records Before Schema Changes Reach Production
The review broke down runtime behavior in a way that matches how backend changes are evaluated during PRs. For example, adding a required region field looked fine on paper, but Qodo pointed out how existing records without that field could cause validation failures during updates.
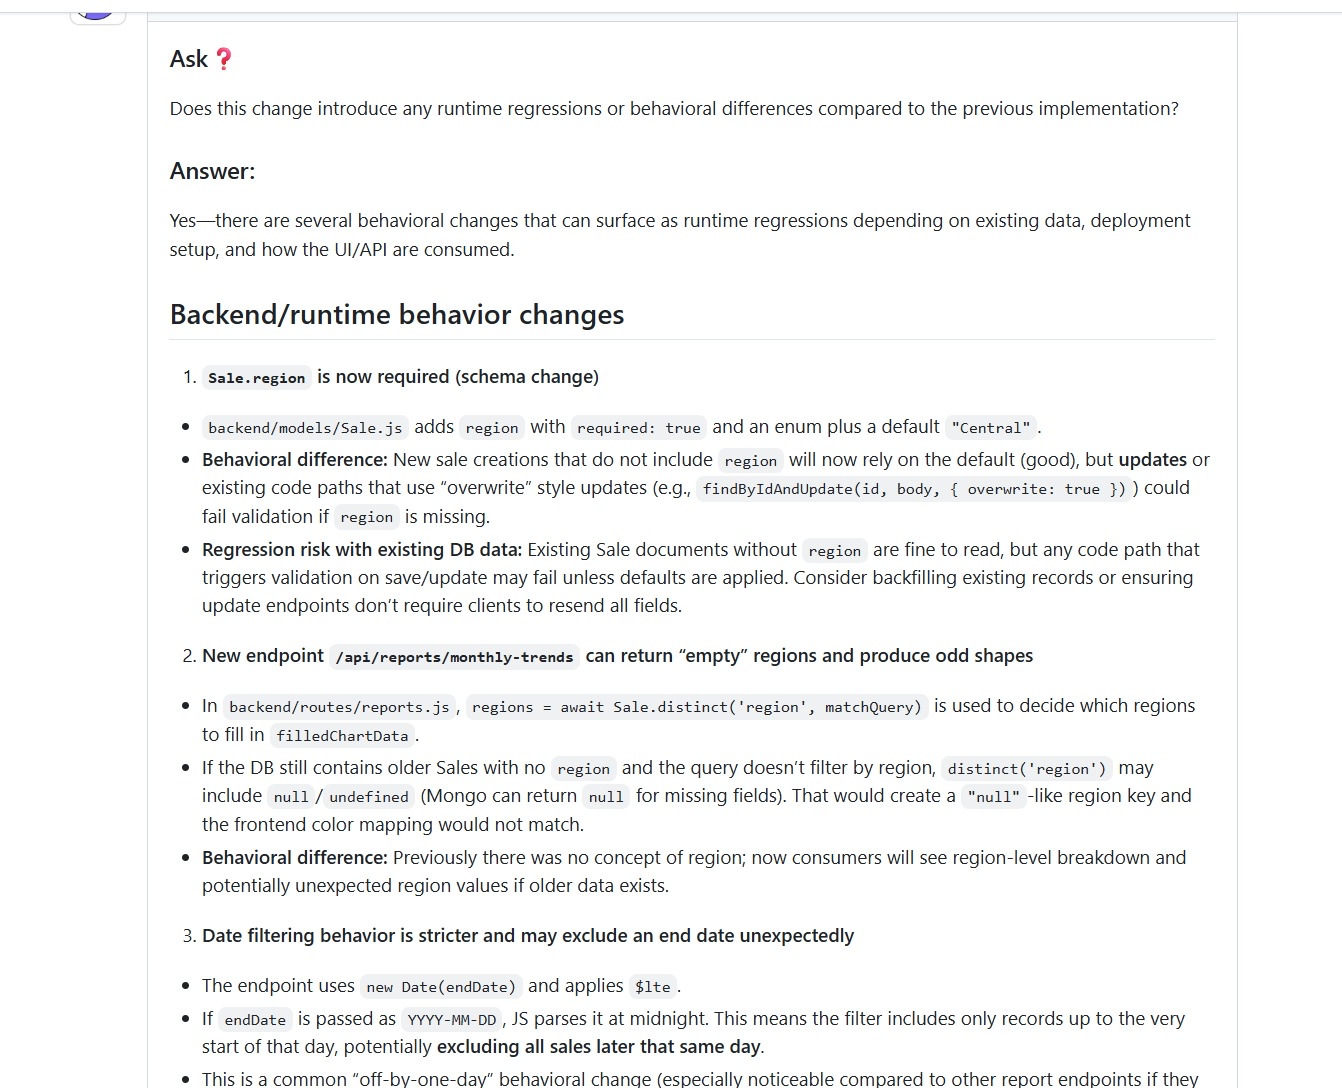
It also flagged how a new reporting endpoint could return null or undefined regions if older data didn’t include that field. That kind of issue doesn’t show up in basic validation. It shows up when someone connects the schema change with real data conditions.
Date filtering logic was another example. The change used a standard date parse, but the review highlighted how it could exclude records from the same day due to how timestamps are interpreted. That’s a classic off-by-one behavior that usually slips through until someone notices discrepancies in reports.
Qodo Detects Manager-Only Endpoints That Expose Route Existence to the UI Even When the API Is Restricted
The same review also evaluated access control and data exposure. The endpoint was protected, but Qodo still checked how it would behave depending on where it’s mounted and how the frontend consumes it.
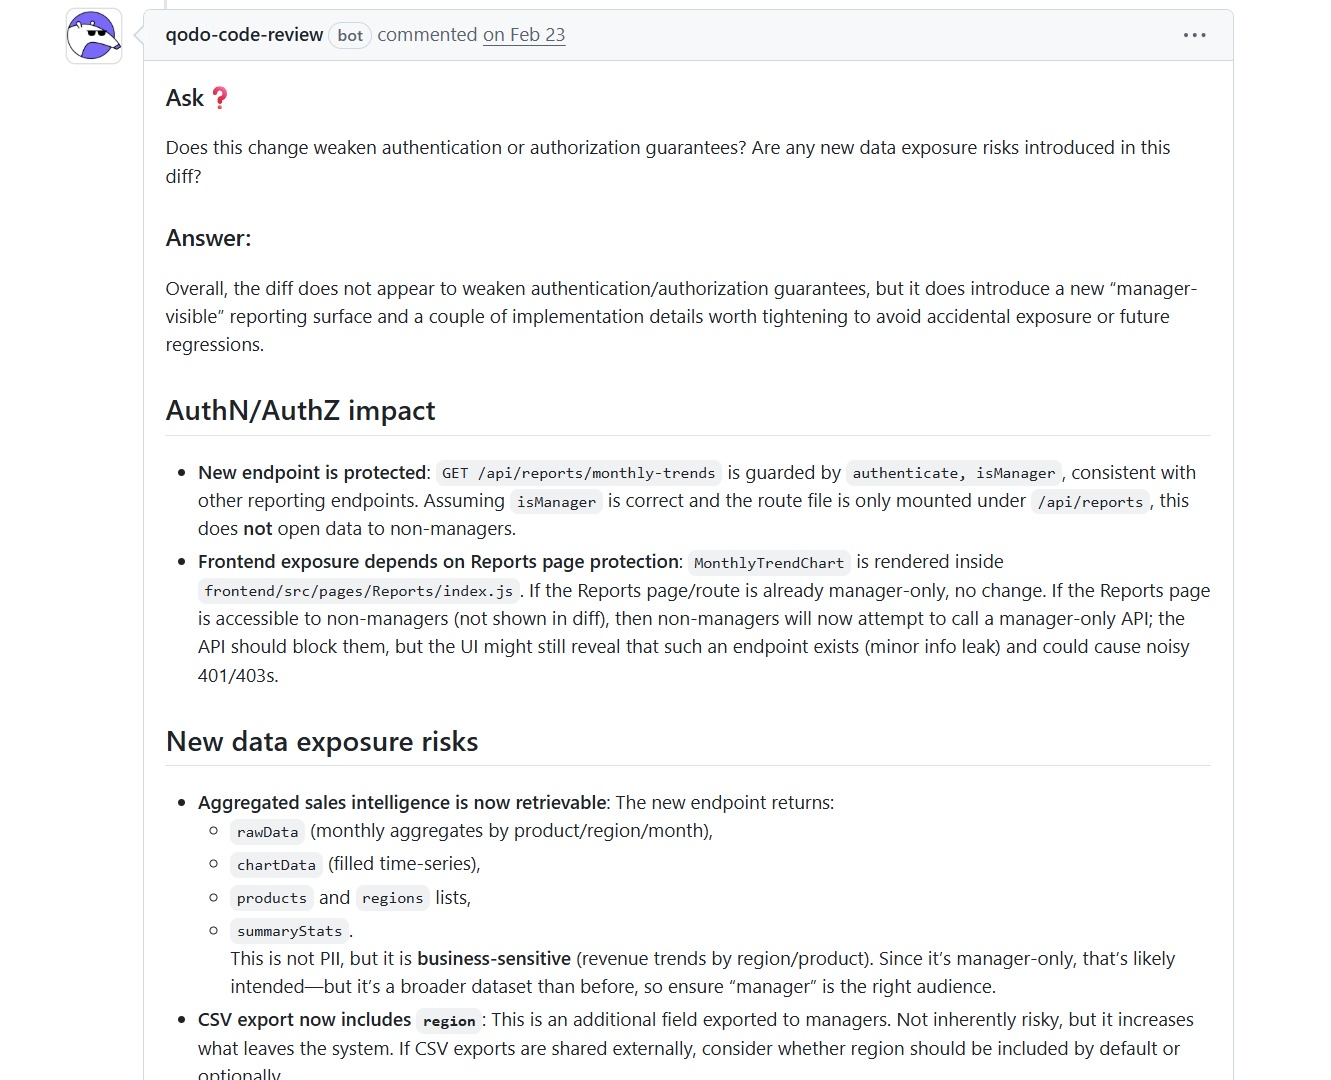
It pointed out that while the API is restricted to managers, the UI could still reveal the existence of that endpoint if routes aren’t properly gated. It also flagged that aggregated sales data, while not sensitive in a strict sense, expands what’s accessible and should be treated carefully depending on the audience.
Qodo Catches Frontend Deploy-First Sequencing Failures Before the Dependent Backend Endpoint Is Live
Plus, I ran the same change through Qodo with a focus on deployment behavior, not just code correctness. The response didn’t stay limited to the diff, it evaluated how the change would behave once deployed across services.
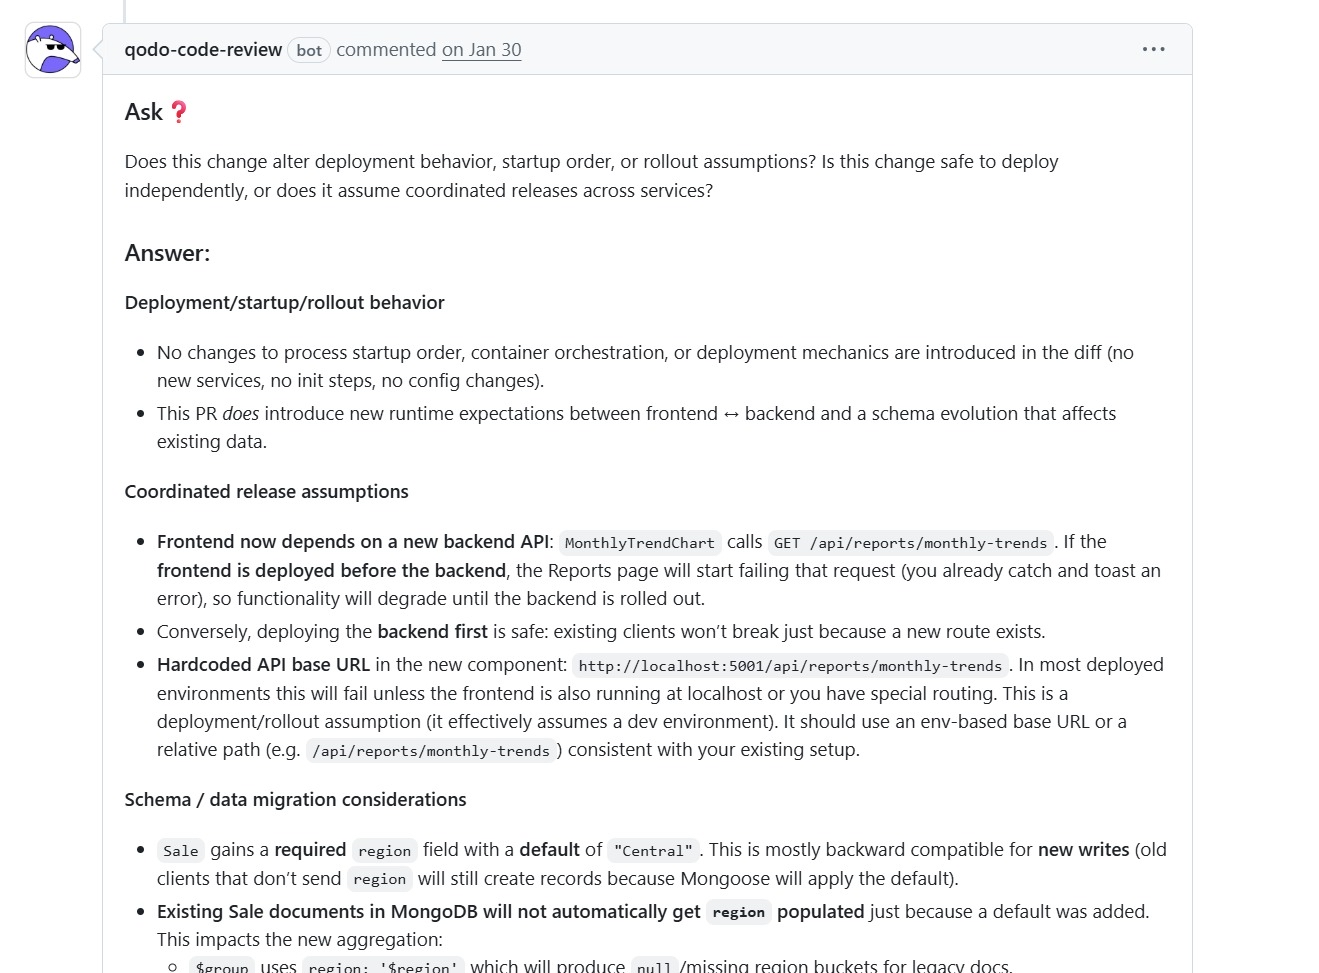
It checked whether the update introduced any changes to startup order, orchestration, or deployment mechanics. In this case, there were no direct infra changes, but it still flagged something more hidden, runtime expectations between frontend and backend had changed. That’s the kind of dependency that usually shows up only after deployment when services are out of sync.
The review pointed out that the frontend now depends on a new backend endpoint. If the frontend is deployed first, parts of the UI will start failing until the backend is available. That’s not a code error, it’s a rollout sequencing issue.
It also flagged a hardcoded API base URL in the frontend. In a local setup, it works. In a real environment, it assumes specific routing or localhost behavior. The suggestion was to switch to an environment-based or relative path, which avoids deployment-specific failures. These are the kinds of issues that typically come up during staging or after partial rollouts, not during static analysis.
Conclusion
Teams add tools when CI-only enforcement leaves gaps: pre-push feedback for editor-stage issues, cross-service contract checking for shared interfaces, and security analysis for dependency chains that rule engines don’t trace. Qodo focuses on surfacing review and CI-style feedback earlier in development.
Most teams do not fully replace SonarQube. They add complementary tools where issues still slip through review, integration testing, or deployment. The biggest gaps usually appear in changes that are technically valid but operationally risky. For example:
- Adding a required field to a shared DTO can cause validation failures on older records.
- Changing an API response shape can return unexpected null values in downstream services.
- Inconsistent error handling across services can break consumers even when each file passes static analysis.
The pattern Qodo points to is consistent across all three: a change that is locally valid but organizationally risky. Qodo’s rules capture what good looks like for your codebase; the review agents enforce those standards on every PR. Rules feed the review. The review feeds the rules.
FAQs
1. How is Qodo different from SonarQube in day-to-day workflows?
SonarQube evaluates code after it’s pushed or during CI. Qodo runs on the change itself while you’re still working. It surfaces the same kinds of issues that would appear in PR review or CI, but earlier in the workflow.
2. Can Qodo replace static analysis tools like SonarQube completely?
No. Static analysis tools are still useful for rule enforcement and compliance checks. Qodo focuses on review-level feedback, behavior, context, and workflow impact. In most teams, it complements existing tools rather than replacing them.
3. What types of issues does Qodo catch that traditional tools miss?
Qodo identifies issues tied to how a change behaves in the repository. This includes regression risks, rollout dependencies, inconsistent patterns across files, and CI or workflow implications. These are not always visible through rule-based scans.
4. Does Qodo help reduce pull request review time?
Yes, because many issues are resolved before the PR is opened. Instead of reviewers pointing out basic fixes, changes already include those corrections. Reviews shift more toward design decisions and edge cases rather than repeated corrections.
5. When should teams consider alternatives to SonarQube?
Teams usually look for alternatives when feedback cycles slow them down, especially in multi-service systems. If issues are repeatedly caught in CI or PR instead of during development, adding tools that bring feedback earlier can reduce rework and improve flow.