13 Best Static Code Analysis Tools For 2025

TL;DR:
- Static code analysis prevents failures and security incidents pre-runtime, and now also helps with architecture (e.g., dependency graphs → microservice boundaries).
- Tools fall into categories: security-focused SAST (Fortify, Veracode, Aikido, Snyk), general-purpose analyzers (SonarQube, PVS-Studio, Codacy, Code Climate), language/IDE-specific (ESLint, ReSharper, Coverity, Qodana), and AI PR-native (Qodo).
- Best-fit by context: individuals/OSS benefit from ESLint, Code Climate, or Qodana free tiers; startups can layer SonarQube CE with Snyk/Aikido; enterprises and regulated industries need Veracode, Fortify, Qodana, and Qodo for compliance, governance, and automation.
- Enterprise needs: cross-repo analysis, strong CI/CD integration, compliance support (on-prem/SOC2), and scalable indexing. Qodo, SonarQube, Veracode, and Fortify stand out in this regard.
- Combine a general analyzer with a security platform, add language/IDE linters for hygiene, and use Qodo for PR-native automation and test/doc generation.
Static code analysis tools are not about “best practices checklists”; they’re about preventing hard failures and security incidents before code ever runs. A good analyzer will flag things like unchecked return values, race conditions, use-after-free, resource leaks, or unsafe input handling that can lead to exploitable bugs. They also enforce consistent coding standards across teams, which matters when you’re reviewing tens of thousands of lines of code from multiple contributors.
These tools aren’t limited to bug-finding. For example, a 2025 MDPI study used static analysis to generate dependency graphs from a monolithic system and then applied a variational autoencoder with a graph neural network to propose microservice boundaries. That kind of work shows how static analysis forms the groundwork not just for catching null dereferences or injection points, but for making architectural changes that would be nearly impossible to reason about manually.
In this article, I’ve reviewed the 13 best static code analysis tools for 2025, grouped into categories: security-focused SAST platforms, general-purpose analyzers, language-specific checkers, and developer-centric security suites. The goal is not to repeat vendor marketing, but to break down where each tool genuinely adds value, where it gets in the way, and which kinds of teams will benefit most.
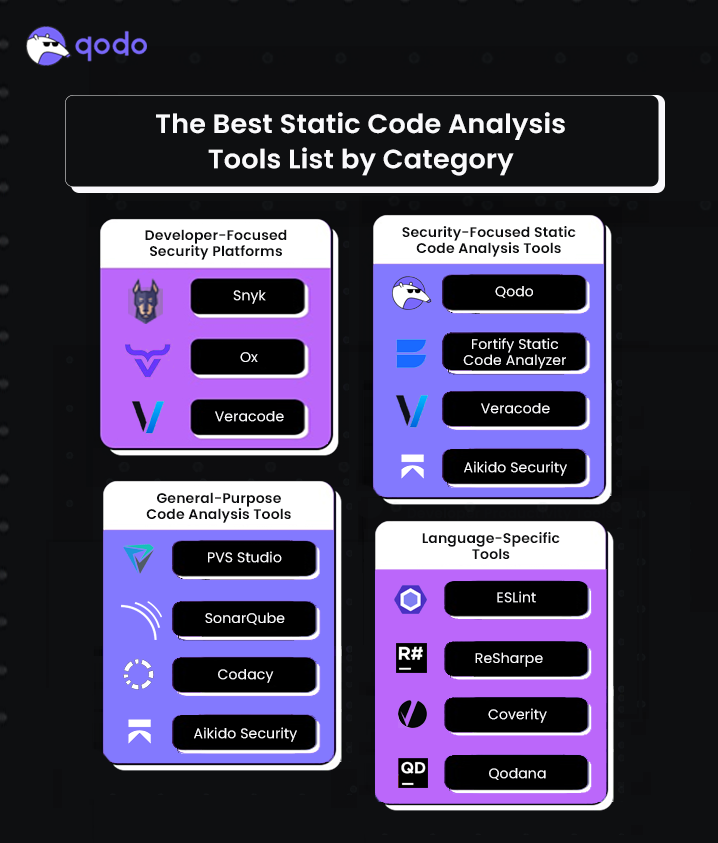
The Best Static Code Analysis Tools List by Category
Security-Focused Static Code Analysis (SAST) Tools
General-Purpose Code Analysis Tools
Language-Specific Tools
Developer-Focused Security Platforms
How I Selected the Best Static Code Analysis Tools in this List
As a developer who’s navigated countless codebases, I’ve learned that writing code is just the beginning-ensuring its quality, security, and maintainability is where the real craft lies. Static code analysis has become an indispensable tool in my development arsenal, offering insights that go far beyond simple syntax checking.
Static code analysis is a sophisticated approach that examines source code without executing it, providing a comprehensive diagnostic of potential issues, vulnerabilities, and quality concerns. It’s like having a meticulous code reviewer who never sleeps, catching problems before they become critical.
When evaluating static code analysis tools, here are the five things I considered:
- Code Error Detection: The ability to identify syntax mistakes, logical flaws, and potential runtime errors before execution.
- Security Analysis: How well the tool uncovers vulnerabilities and enforces security best practices.
- Code Quality Metrics: Evaluation of complexity, readability, and adherence to industry best practices.
- Coding Standards Enforcement: Ensuring consistency with established guidelines for maintainability.
- Performance Optimization: Identifying bottlenecks that could impact the efficiency of the code.
13 Best Static Code Analysis Tools For 2025
1. Qodo (formerly Codium)
Qodo does static code analysis directly into the pull request workflow. It doesn’t just lint or scan files; it analyzes changes at the component level (functions, classes, methods) and then gives developers interactive options to generate tests, add documentation, suggest improvements, or search for similar code. This helps teams catch issues earlier, maintain consistent documentation, and enhance review quality without leaving GitHub, GitLab, or Bitbucket.
Key Features
- Analyze PR (/analyze) — Lists all changed components and allows interactive actions on each (tests, docs, suggestions, similar code).
- Generate Tests (/test component_name) — Creates targeted tests for a function, class, or method touched by the PR.
- Generate Docs (/add_docs component_name) — Produces docstrings for updated components to keep documentation aligned with code.
- Code Suggestions (/improve_component component_name) — Provides refactor or style improvements at a component level.
- Similar Code Search — Finds related implementations inside your org’s repos or open source, with license details.
- Multi-language Support — Works with Python, Java, C++, JavaScript, TypeScript, C#, Go, Ruby, PHP, Rust, Kotlin, and Scala.
- Git Integration — Runs natively inside GitHub, GitLab, and Bitbucket PRs via simple comment commands.
Pros
- Deep PR integration, no need for external dashboards.
- Component-level focus ensures precise analysis and suggestions.
- Automates repetitive work (tests, docs, improvements) inside reviews.
- Similar-code search helps reduce duplication and ensures license compliance.
Cons.
- Credit consumption can be high for larger teams or heavy PR activity.
- Enterprise features are locked behind paid plans
Hands-on section
For my hands-on evaluation , I integrated Qodo AI-powered PR review assistant with a User Management microservice that I had built with features like JWT authentication, RBAC, bcrypt password handling, and policies (gitleaks, npm audit, CI enforcement).
To test Qodo in action, I raised a pull request with changes across multiple components, including authentication services, role checks, error handling, and storage utilities. As shown in the snapshot below:
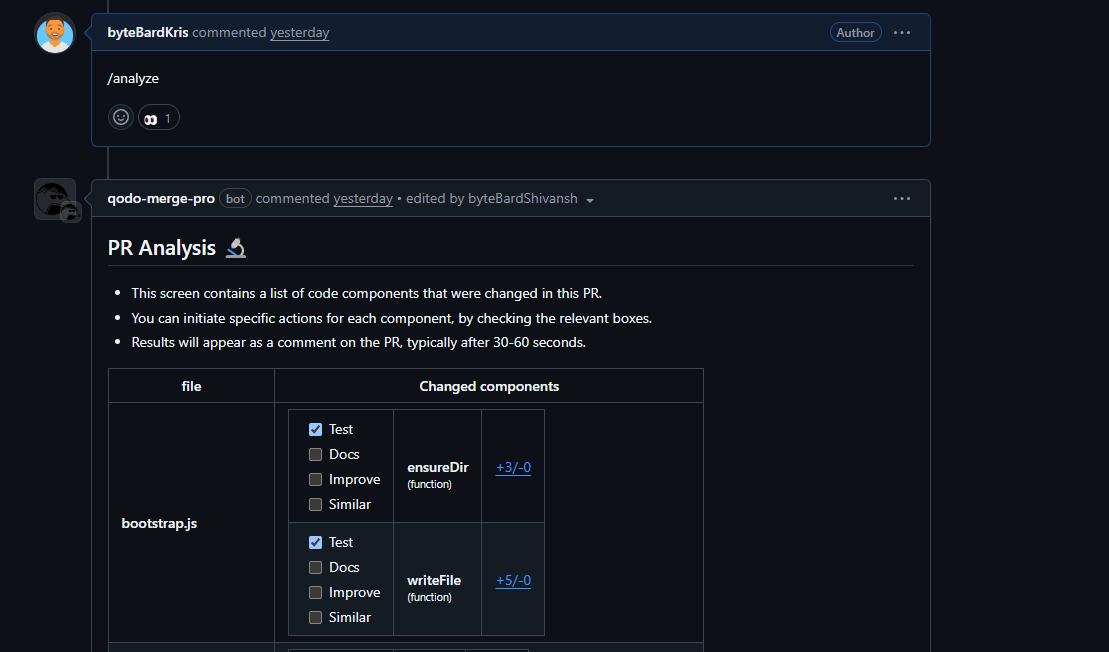
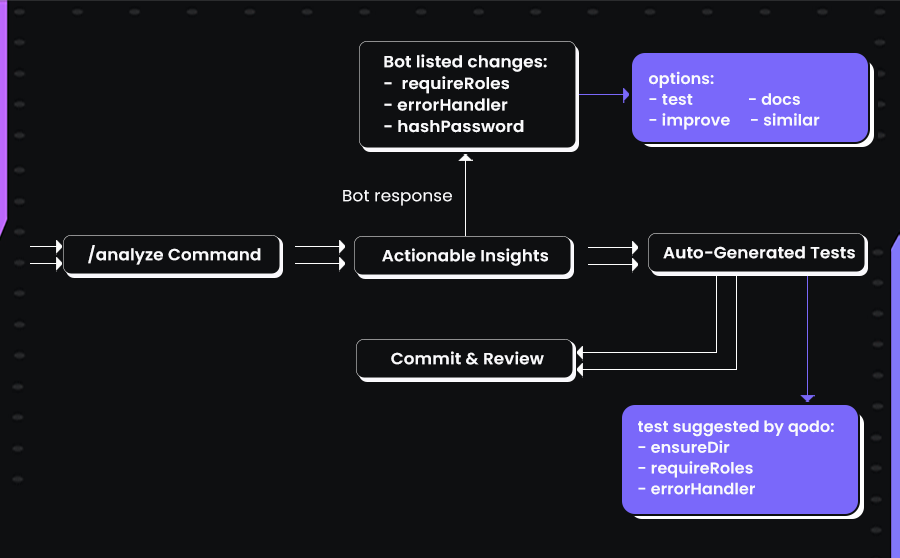
The PR comments, I triggered Qodo using the /analyze command. Within less than a minute, the Qodo bot responded with a detailed breakdown of all modified functions, grouped file-by-file. Each function came with actionable options: Test, Docs, Improve, and Similar.
I selected the Test option on several functions, and Qodo instantly generated context-aware unit tests. For example:
- For ensureDir, it suggested happy-path tests for creating directories, idempotent behavior, and edge cases like invalid paths.
- For writeFile, it generated scenarios to validate parent directory creation, UTF-8 encoding integrity, and error propagation.
- For toInt, it covered integer parsing, fallback defaults, and handling of negative numbers.
- For requireRoles, it produced tests for authorized, unauthorized, and forbidden role scenarios.
- For errorHandler, it created cases for explicit error messages, missing statuses, and fallback defaults.
What stood out was how realistic and production-ready the generated tests were. They didn’t just check trivial cases; they reflected edge conditions I would normally write manually. The tests also adhered to best practices, such as propagating errors instead of swallowing them, to ensure visibility of failures.
Another strong point was consistency: Qodo kept its suggestions aligned with the security policies I had enforced in CI (like strong password handling and JWT token revocation). It felt less like a generic AI assistant and more like an extra reviewer tuned to enterprise-grade coding standards.
Overall, the workflow was smooth: Raise PR → run /analyze → get actionable insights → auto-generate meaningful tests → commit and review. Here’s a visual walkthrough of how Qodo does the analysis:
The only trade-off was that on larger diffs, analysis sometimes took a bit longer than 60 seconds, but the value of precise feedback outweighed the wait. In practice, Qodo significantly reduced the time I’d normally spend writing and reviewing boilerplate tests, while also catching subtle edge cases. For teams working on secure microservices or compliance-heavy environments, this makes it a genuine productivity booster rather than just an autocomplete gimmick.
Qodo’s Pricing
- 14-day trial — full platform, unlimited reviews and credits, no credit card required. At the end of the trial, an in-product screen recommends the right credit pack based on usage.
- Pro Teams (designed for up to 30 users) — unlimited users per workspace, monthly billing, customer-set overage cap, switch packs anytime, overage credits never expire. Pick a credit pack that fits your volume:
- $30/mo → ~18 reviews/mo (2,500 credits)
- $60/mo → ~36 reviews/mo (5,000 credits)
- $240/mo → ~143 reviews/mo (20,000 credits)
- …and larger packs up to ~1,200+ reviews/mo
- Enterprise (built for 30+ users) — custom pricing; adds SSO/SAML, audit logs, BYOK, governance analytics dashboard, single-tenant SaaS or on-prem, priority support and dedicated CSM
2. PVS-Studio
I’ve found PVS-Studio to be a powerful static code analysis tool that helps catch security vulnerabilities and bugs early in development. It supports multiple languages, including C, C++, C#, and Java, making it a versatile option for different projects.
Pros
- Comprehensive bug detection: PVS-Studio does a great job identifying errors and potential issues, reducing the chances of runtime failures.
- Code quality suggestions: It doesn’t just flag errors; it also suggests improvements, helping me write cleaner and more efficient code.
- Security vulnerability scanning: One of the standout features is its ability to detect security risks, which is crucial for writing secure applications.
- Detailed reports: The tool generates in-depth reports that provide insights into code quality, bugs, and vulnerabilities, making it easier to track and fix issues.
- Seamless integrations: It integrates well with various IDEs, CI/CD pipelines, and build systems, fitting smoothly into my workflow.
- Cross-platform support: Whether I’m working on Windows, macOS, or Linux, I can install and use PVS-Studio without issues.
Cons
- Pricing transparency: You have to request pricing instead of seeing it upfront, which can be inconvenient if you’re comparing tools.
- Learning curve: The tool provides detailed analysis, but that also means it might take some time to fully understand and configure it to avoid false positives.
- Performance impact: Running a full analysis on large codebases can slow down the development environment, especially on lower-end machines.
Hands-on section:
For this evaluation, PVS-Studio was integrated into a C++ solution that included multiple GoogleTest and GoogleMock targets, simulating a real-world service codebase with unit and integration tests. The extension was installed, and the analyzer was run directly from the IDE. To avoid irrelevant noise, third-party and generated code were excluded, and a suppression file was created so recurring legacy issues would not interfere with new findings.
As shown in the snapshot below:
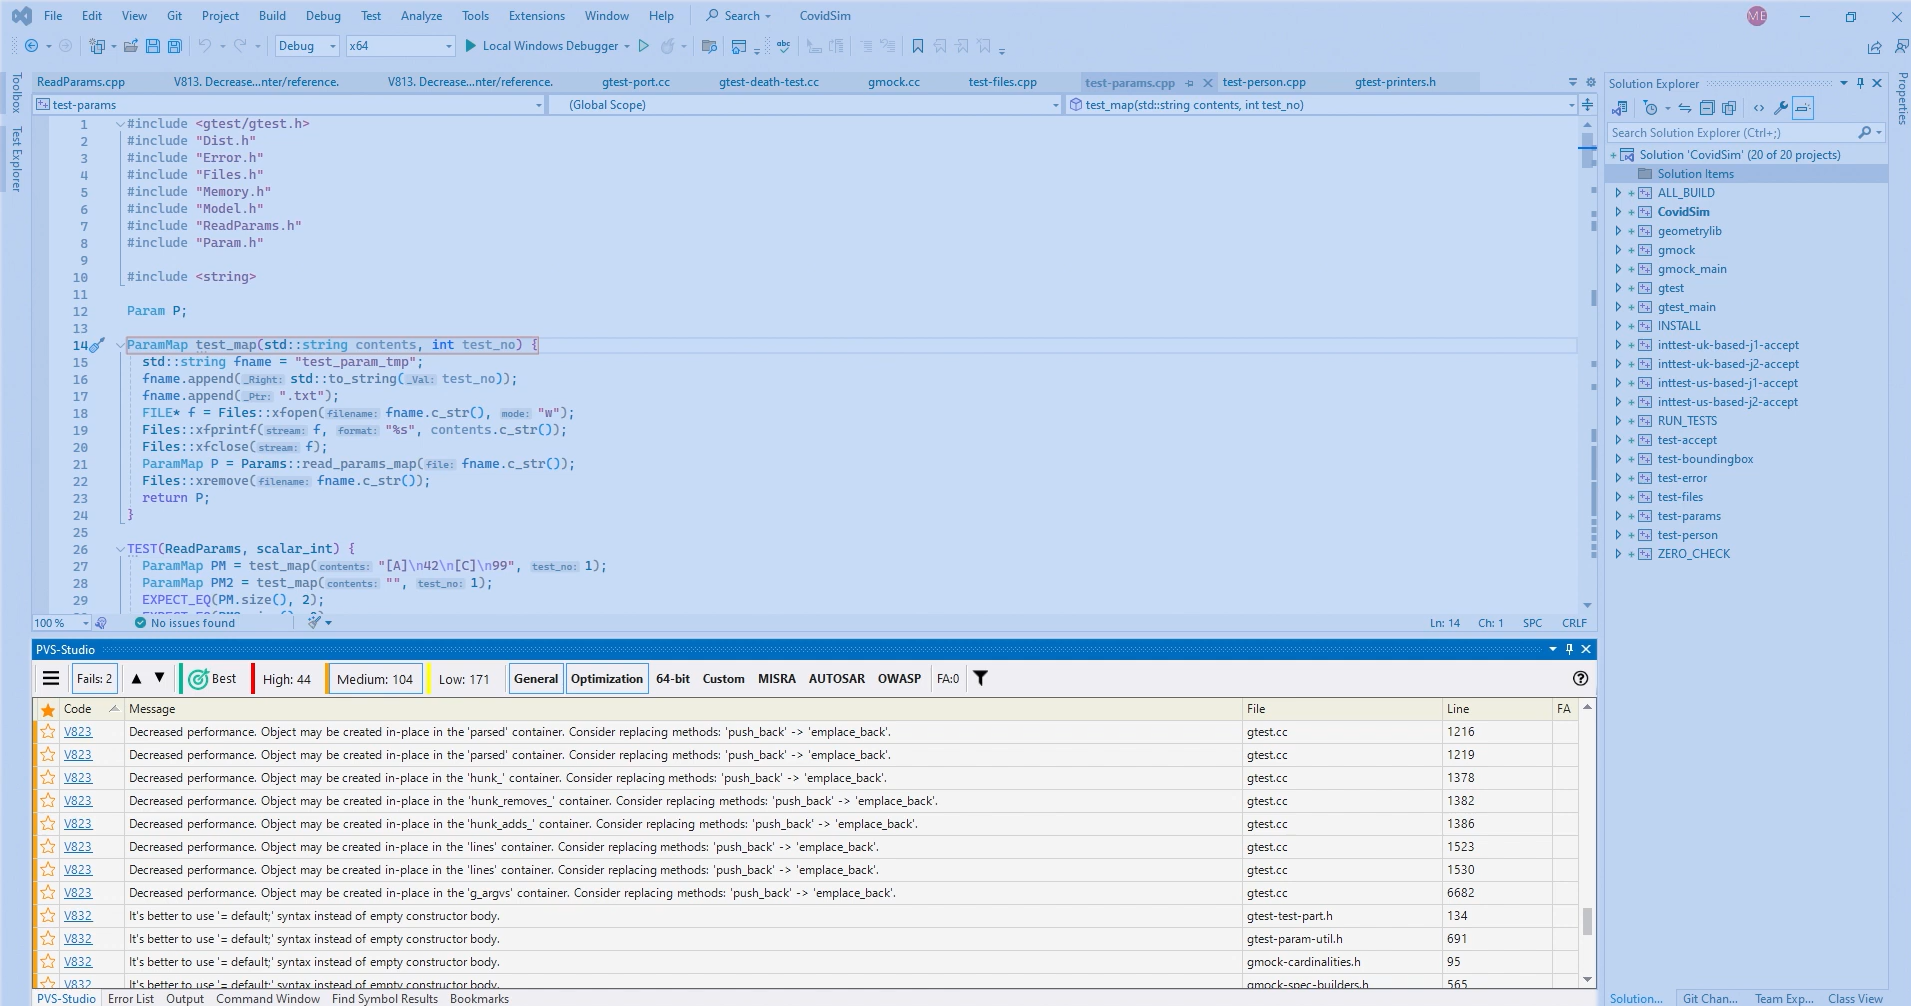
The first scan generated a structured list of warnings categorized by rule sets, including General, Optimization, and OWASP. One recurring issue was V823, where the analyzer recommended replacing push_back with emplace_back to remove unnecessary object copies; these appeared in several GoogleTest sources. Alongside performance hints, the analyzer flagged:
- unchecked return values in utility functions,
- redundant temporaries that could be simplified with move semantics,
- unsafe uses of older C-style functions.
Each issue was linked to detailed documentation, making it easy to understand both the cause and the fix. Fixes were applied in order of severity: security and correctness issues first, then performance improvements. Optimization warnings like V823 were batch-handled with quick edits and validated against the test suite, while third-party library results were suppressed permanently. This left a lean, high-signal set of warnings that could be re-scanned with confidence.
To extend coverage into CI, the command-line version was connected to the build pipeline:
- pvs-studio-analyzer was used to trace and analyze builds.
- Logs were converted with plog-converter into both HTML reports and error files.
- Pull requests were blocked if new high- or medium-severity issues appeared, while full HTML reports were published as artifacts.
Although full-solution scans were resource-intensive, incremental analysis on changed projects was quick enough to run before commits. With exclusions and suppressions in place, the analyzer became a reliable safety net, consistently catching hidden correctness issues and security risks while steadily reducing performance nits across the codebase.
Pricing
While pricing depends on the user type (individual, team, enterprise), they do offer a free trial, plus free access for students, teachers, and open-source projects.
3. ESlint
I’ve been using ESLint for static code analysis in JavaScript projects, and it’s an essential tool for maintaining clean, efficient, and error-free code. It helps catch potential issues early and even offers automatic fixes for common problems.
Pros
- Effective bug detection: ESLint scans JavaScript code thoroughly and identifies potential bugs and syntax errors before they cause problems.
- Automatic fixing: Many issues can be fixed automatically, reducing manual debugging time.
- Highly configurable: I can customize the rules based on project requirements, use different parsers, and extend it with plugins.
- Seamless integration: Works smoothly with popular IDEs like VS Code, Eclipse, and IntelliJ IDEA, as well as CI/CD pipelines.
- Easy installation: Can be installed quickly using npm, yarn, or npx, making it accessible for any JavaScript developer.
Cons
- Occasional false positives: Sometimes, ESLint flags issues that aren’t necessarily problematic, requiring manual review and rule adjustments.
- Limited to JavaScript: It’s a great tool for JavaScript and TypeScript, but if you work with multiple languages, you’ll need additional tools for other codebases.
Hands-on section
When I dropped ESLint into the project, setup was painless. I ran npm init @eslint/config@latest, picked JavaScript with CommonJS modules, no framework, browser runtime, and it generated the eslint.config.mjs for me. Dependencies (eslint, @eslint/js, globals) installed in seconds, and I was ready to lint.
Running npx eslint . flagged 13 errors. Most were straightforward:
- In scripts/bootstrap.js, ESLint complained about unnecessary escape characters like \” and \s under the no-useless-escape rule.
- In auth.js, authService.js, and errorHandler.js, it pointed out unused variables (e in catch blocks and next in middleware) under the no-unused-vars rule.
Here’s a slice of what the output looked like:
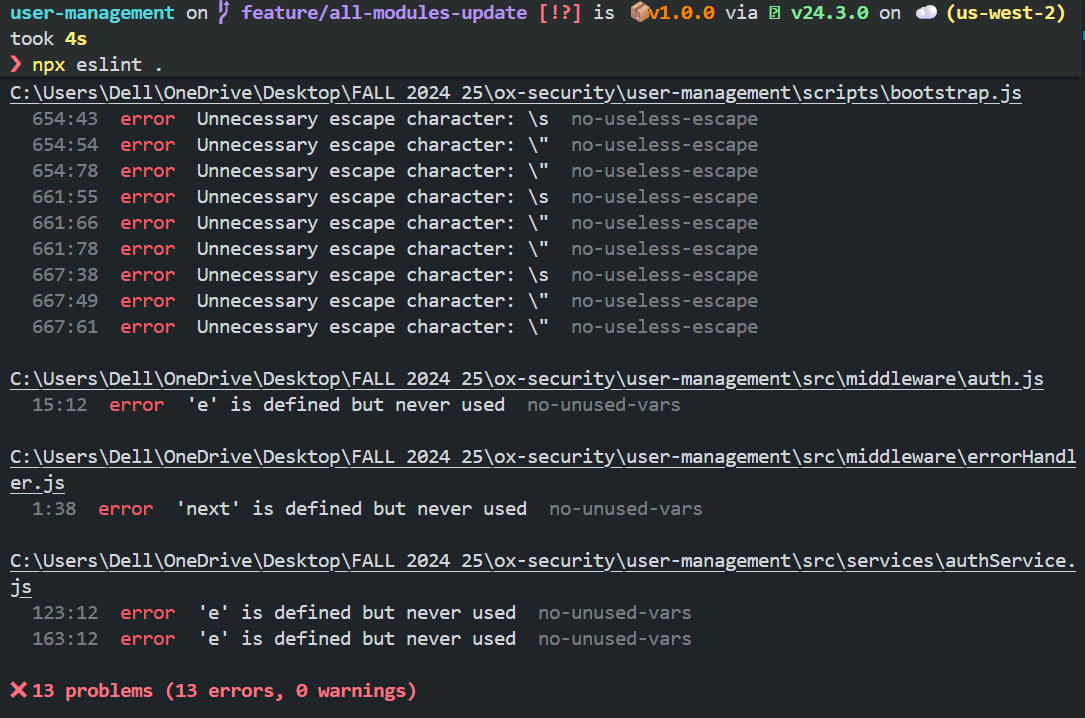
Fixing it didn’t take long. I stripped out the redundant regex escapes, removed or used the unused variables, and re-ran ESLint. The second run came back clean.
Nothing fancy here, but that’s exactly the point. ESLint keeps the codebase free of small hygiene issues that reviewers shouldn’t have to spend time pointing out.
Pricing
ESLint is completely free to use. Since it’s an open-source project, there are no paid plans, making it an excellent choice for individuals and teams looking for a cost-effective static analysis tool.
4. SonarQube
I’ve used SonarQube for static code analysis, and it’s a solid tool for maintaining code quality, security, and reliability. It integrates well with DevOps workflows and supports a wide range of programming languages, making it a great choice for teams working on diverse projects.
Pros
- Comprehensive bug detection: SonarQube helps identify defects that could lead to unexpected behaviors, improving overall code reliability.
- Broad language support: With support for 30+ languages and frameworks, it’s a versatile choice for multi-language projects.
- Static application security testing (SAST): The built-in SAST engine detects deeply hidden vulnerabilities, making it essential for secure development.
- Quality gates for CI/CD: It enforces code quality standards by automatically blocking deployments if metrics aren’t met.
- Detailed reporting and dashboards: The extensive reports help track technical debt, security risks, and maintainability metrics over time.
Cons
- Customization challenges: Fine-tuning rules and adjusting quality gates for specific project needs may take extra effort.
- Pricing for advanced features: While the free edition is great, premium features are only available in paid versions, which might not be budget-friendly for smaller teams.
Hands-on section
A scan of a PHP service surfaced a critical SQL injection vulnerability as shown in the snapshot below:
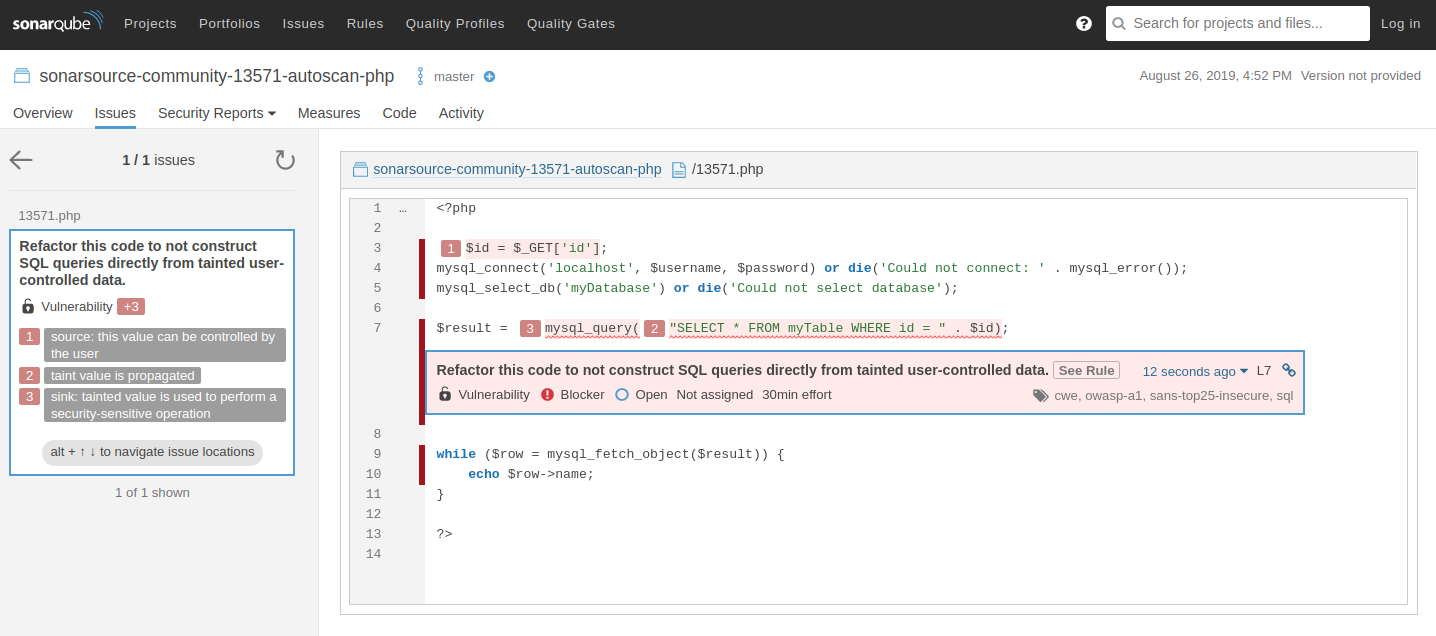
In the above snapshot the issue was located in 13571.php, where a request parameter was being concatenated directly into a SQL query:
$id = $_GET['id'];
$result = mysql_query("SELECT * FROM myTable WHERE id = " . $id);
The analysis broke down the vulnerability step by step:
- Source: the $_GET[‘id’] parameter is controlled by the user.
- Propagation: the tainted value flows into the $id variable with no validation.
- Sink: $id is directly appended into the SQL string, allowing malicious input to alter the query.
The issue was classified as a Blocker, tied to CWE, OWASP A1, and SANS Top 25 insecure coding practices, with an estimated remediation time of 30 minutes. This framing highlighted both severity and impact.
The recommended fix was to refactor the query to use parameterization instead of string concatenation:
$stmt = $pdo->prepare('SELECT * FROM myTable WHERE id = :id');
$stmt->execute(['id' => $_GET['id']]);
$result = $stmt->fetchAll();
Using prepared statements ensures the query structure is fixed, and user input is treated strictly as data rather than executable code.
The SonarQube Cloud interface also visualized the taint flow from source → propagation → sink, making it clear how untrusted data reached a sensitive operation. After applying the fix and rerunning the scan, the vulnerability cleared from the report, confirming the remediation.
Pricing
SonarQube offers a free Community Edition with essential features, while paid plans (Developer, Enterprise, and Datacenter Editions) provide advanced capabilities like enhanced security analysis, branch scanning, and enterprise governance.
5. Fortify Static Code Analyzer
I’ve explored Fortify Static Code Analyzer for security-focused static analysis, and it stands out as a powerful tool for identifying and mitigating vulnerabilities early in the development process. It’s particularly useful for organizations that prioritize security in large and complex codebases.
Pros
- Extensive vulnerability coverage: Detects over 1,600 types of security vulnerabilities across 35+ programming languages, making it highly comprehensive.
- Deep security scanning (SAST & DAST): Uses both static (SAST) and dynamic (DAST) analysis methods to uncover vulnerabilities before they become critical.
- Scalability for large codebases: Handles massive and complex projects efficiently while optimizing performance and reducing false positives by up to 95%.
- Integration with DevOps and development tools: Works seamlessly with Jenkins, Jira, Azure DevOps, Eclipse, and Microsoft Visual Studio.
- Enterprise-level security compliance: Aligns with security standards like OWASP, NIST, and PCI DSS, making it a strong choice for regulated industries.
Cons
- No free trial: Unlike some competitors, Fortify Static Code Analyzer doesn’t offer a free trial, which makes it difficult to evaluate before purchasing.
- Pricing transparency: You have to request pricing, which can be inconvenient if you’re comparing different security analysis tools.
Hands-on section
When the Fortify static analysis was run on the JavaScript codebase, it flagged two Cross-Site Scripting (DOM) issues. Both were tied to the isURLSameOrigin.js file, specifically inside the resolveURL() function.
As visible in the snapshot below:
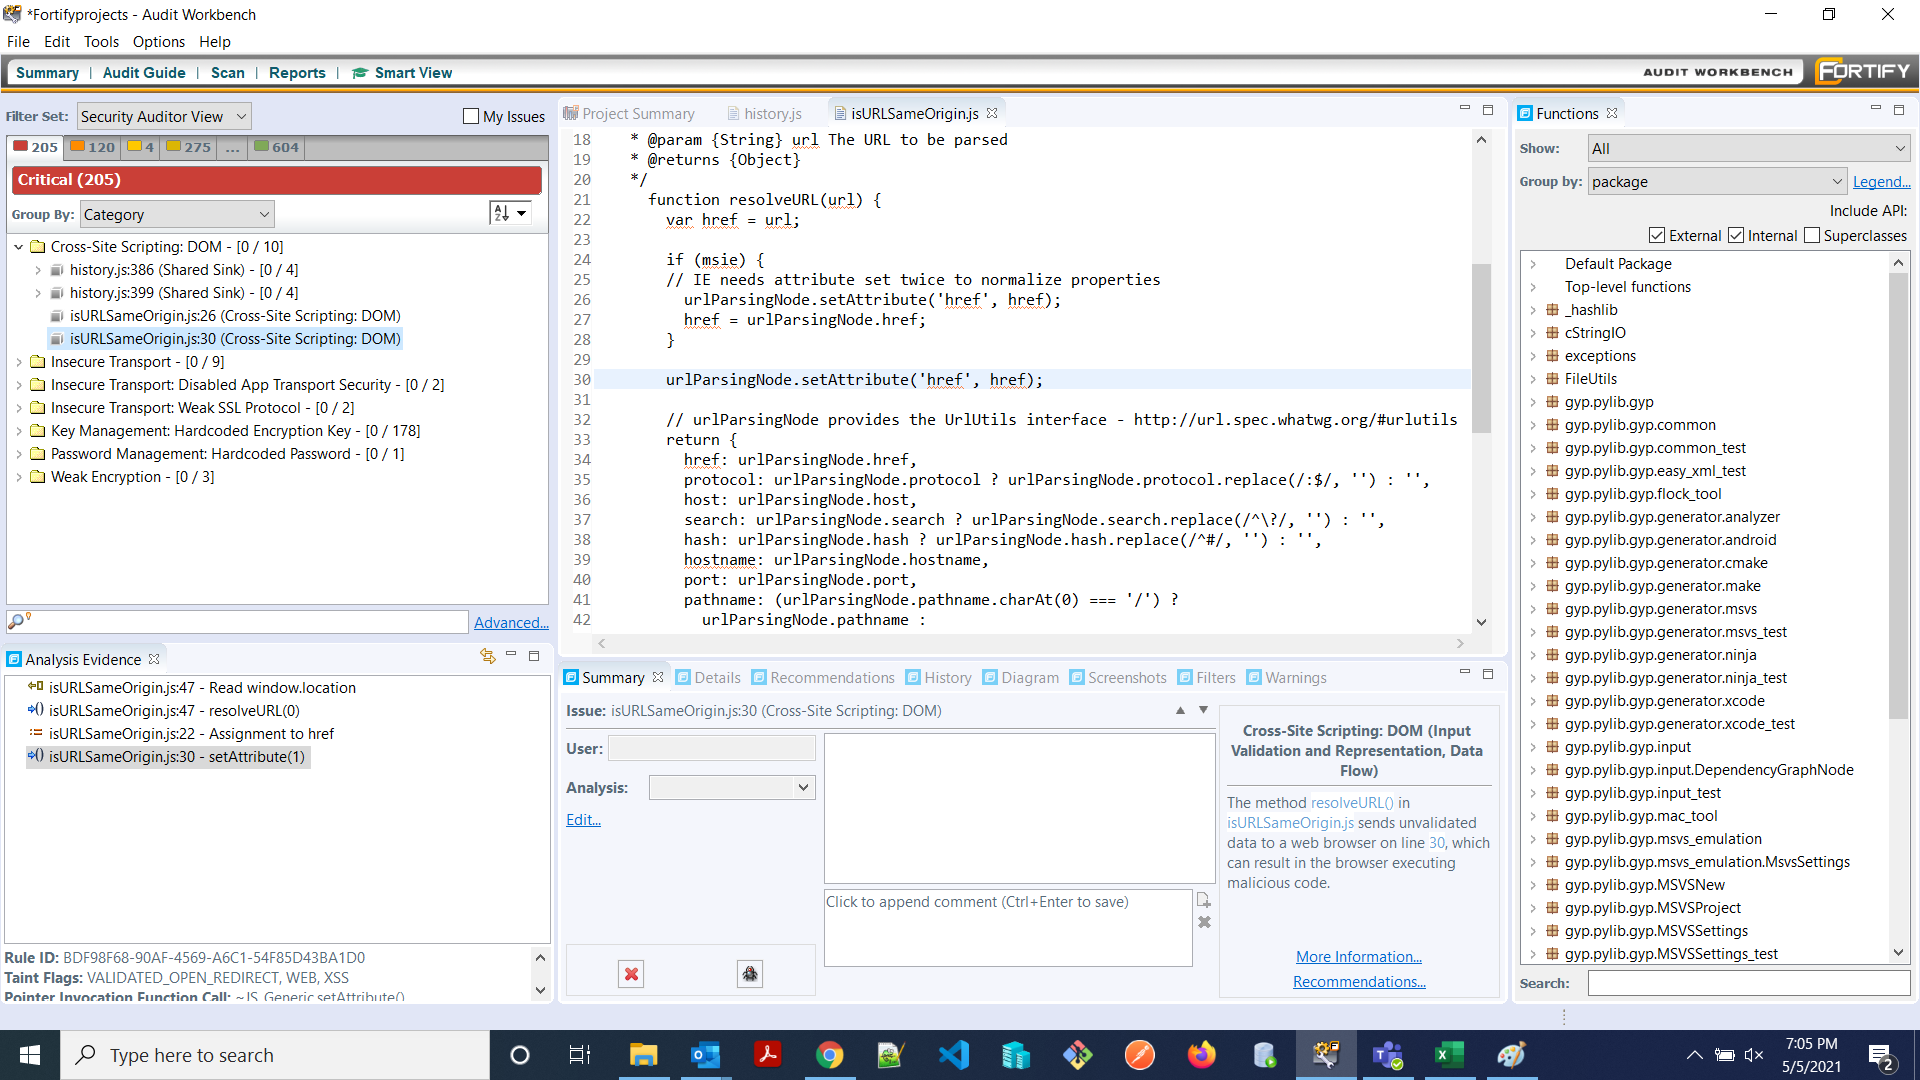
The analyzer traced how unvalidated user input (url) was being assigned to href and then directly pushed into the DOM with urlParsingNode.setAttribute(‘href’, href);. This flow, from source (url controlled by the user) → propagation (assignment to href) → sink (setAttribute), was highlighted as unsafe because it could allow malicious input to inject executable scripts into the browser.
The evidence panel in the above visual of Fortify broke down the flow clearly:
- Line 22: Assignment to href
- Line 30: Tainted value used in setAttribute()
- Line 47: Eventually consumed when the browser processes the attribute
Both flagged items carried the same root cause: lack of validation/encoding before writing untrusted data into the DOM.
For remediation, the recommended fix is to sanitize or encode the input before applying it. Libraries like DOMPurify or context-aware escaping functions should be applied. At a minimum, resolveURL() should validate that the input URL matches expected patterns (e.g., protocol, host) and escape dangerous characters before assignment.
In terms of severity, Fortify marked these as Critical vulnerabilities because a successful exploit would allow arbitrary JavaScript execution, opening the door to account takeover or data exfiltration. The audit workbench linked the issue back to CWE and OWASP categories, mapping it to CWE-79 (XSS) and OWASP A7 (Cross-Site Scripting), giving additional references for secure coding practices.
With both issues clearly localized and reproducible, the next step is to refactor resolveURL() so that tainted input cannot directly flow into sensitive DOM sinks. A fix would be straightforward but essential: add strict input validation, whitelist allowed URL formats, and ensure attributes are set only with sanitized values.
Pricing
Fortify Static Code Analyzer does not provide public pricing details, and there are no free trial options. Organizations need to request a quote based on their specific requirements.
6. Coverity
I’ve worked with Coverity for static code analysis, and it’s a robust tool that helps streamline the development process by identifying errors, bugs, and security vulnerabilities early on. It’s particularly effective at analyzing large codebases and providing detailed insights into issues.
Pros
- Thorough bug and error detection: Coverity meticulously scans code to identify bugs and errors that could lead to unexpected behavior or crashes.
- Root cause analysis: One of the standout features is its ability to not only detect issues but also explain the root cause of each problem, making it easier to fix.
- Wide language support: Coverity supports a variety of languages, including JavaScript, Java, C, C++, C#, Ruby, and Python, making it suitable for diverse projects.
- DevOps and IDE integration: It integrates smoothly with GitLab, GitHub, Jenkins, and Travis CI and supports plugins for popular IDEs like VS Code, making it easy to incorporate into existing workflows.
- Free for open-source projects: Coverity offers a free version for open-source projects, which is a great option for developers contributing to the community.
Cons
- Heavy on resources: Running scans, particularly on large codebases, can be resource-intensive and may slow down the development process.
- Pricing for commercial use: While free for open-source projects, commercial use of Coverity requires a paid license, and pricing details are typically provided upon request.
- False positives: Coverity might flag some issues that aren’t actual problems, so manual review and fine-tuning of rules may be needed.
Hands-on section
When Coverity was pointed at the VAAPI driver code, it immediately flagged a series of uninitialized variable issues in i965_test_image_utils.cpp.
As shown in the snapshot below:
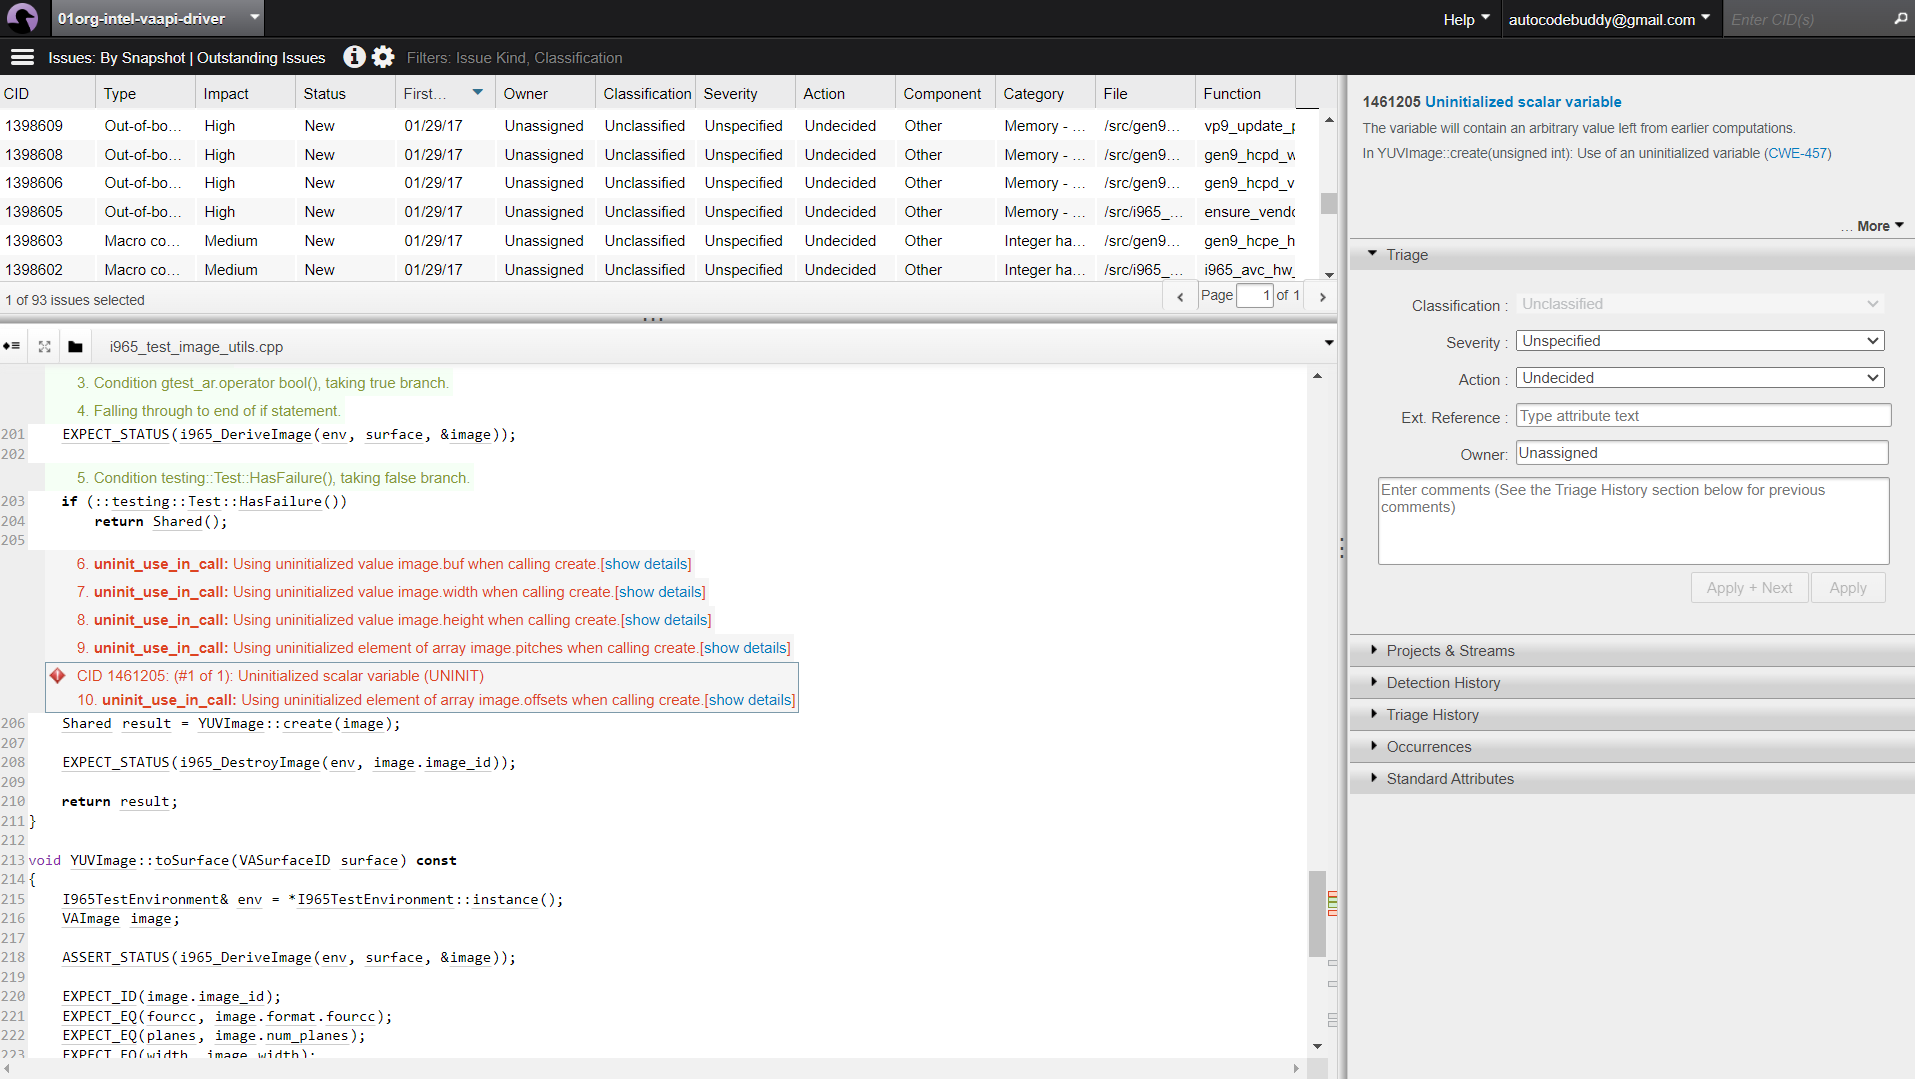
The core problem showed up in the YUVImage::create() call: several fields of the image structure (buf, width, height, pitches, offsets) were being used without ever being initialized.
The analyzer traced the flow clearly, the image object was passed straight into create() around line 210, and Coverity raised CWE-457: Uninitialized scalar variable. Each uninitialized field carried arbitrary memory values, which could cascade into rendering errors or memory corruption in downstream operations. The fix is straightforward but critical: zero out the struct before use or enforce explicit initialization of each member before calling create(). Something as simple as:
YUVImage image = {};
Shared result = YUVImage::create(image);
or, in older codebases: memset(&image, 0, sizeof(image)); ensures no garbage values sneak into the pipeline. With this in place, re-running the scan drops the uninitialized variable warnings, leaving a cleaner report and reducing the risk of subtle, hard-to-debug runtime crashes.
Pricing
Coverity offers free usage for open-source projects with registration. For commercial use, you’ll need to request a quote based on the size and complexity of your projects, as there are no clear public pricing details.
7. Codacy

I’ve used Codacy as part of my workflow for code analysis, and it’s a great tool for maintaining high-quality software with an emphasis on security and performance. Its seamless integration with various platforms and support for a wide range of languages make it adaptable to many different projects.
Pros
- Comprehensive code health monitoring: Codacy continuously reviews code, identifying bugs, suggesting improvements, and ensuring better code quality, performance, and behavior.
- Clear visibility with dashboards: The dashboards provide easy access to metrics on code health, making it easy to monitor and improve repository quality over time.
- Security risk management: Codacy excels at identifying security risks and vulnerabilities, prioritizing them with risk dashboards, and providing actionable insights for fixing them.
- Advanced security features (SAST, IaC, hard-coded secrets): It offers SAST for static code analysis, hard-coded secrets detection, and other security-focused tools to keep your code secure.
- Broad tool and language support: Codacy supports a wide range of tools, languages, and frameworks such as GitHub, GitLab, Bitbucket, Jira, JavaScript, TypeScript, C++, and Kubernetes.
Cons
- Free plan limitations: The free version provides basic functionality, but advanced features like detailed security scans and enhanced reporting are locked behind the paid plans.
- False positives: Like many static analysis tools, Codacy may occasionally flag non-issues, which requires manual review and rule adjustments.
Hands-on section
Hooking up Codeacy to the PHARE repo gave me a clear picture of problem areas right away. The dashboard in the snapshot below splits findings by severity and category, which made triage less of a guessing game:
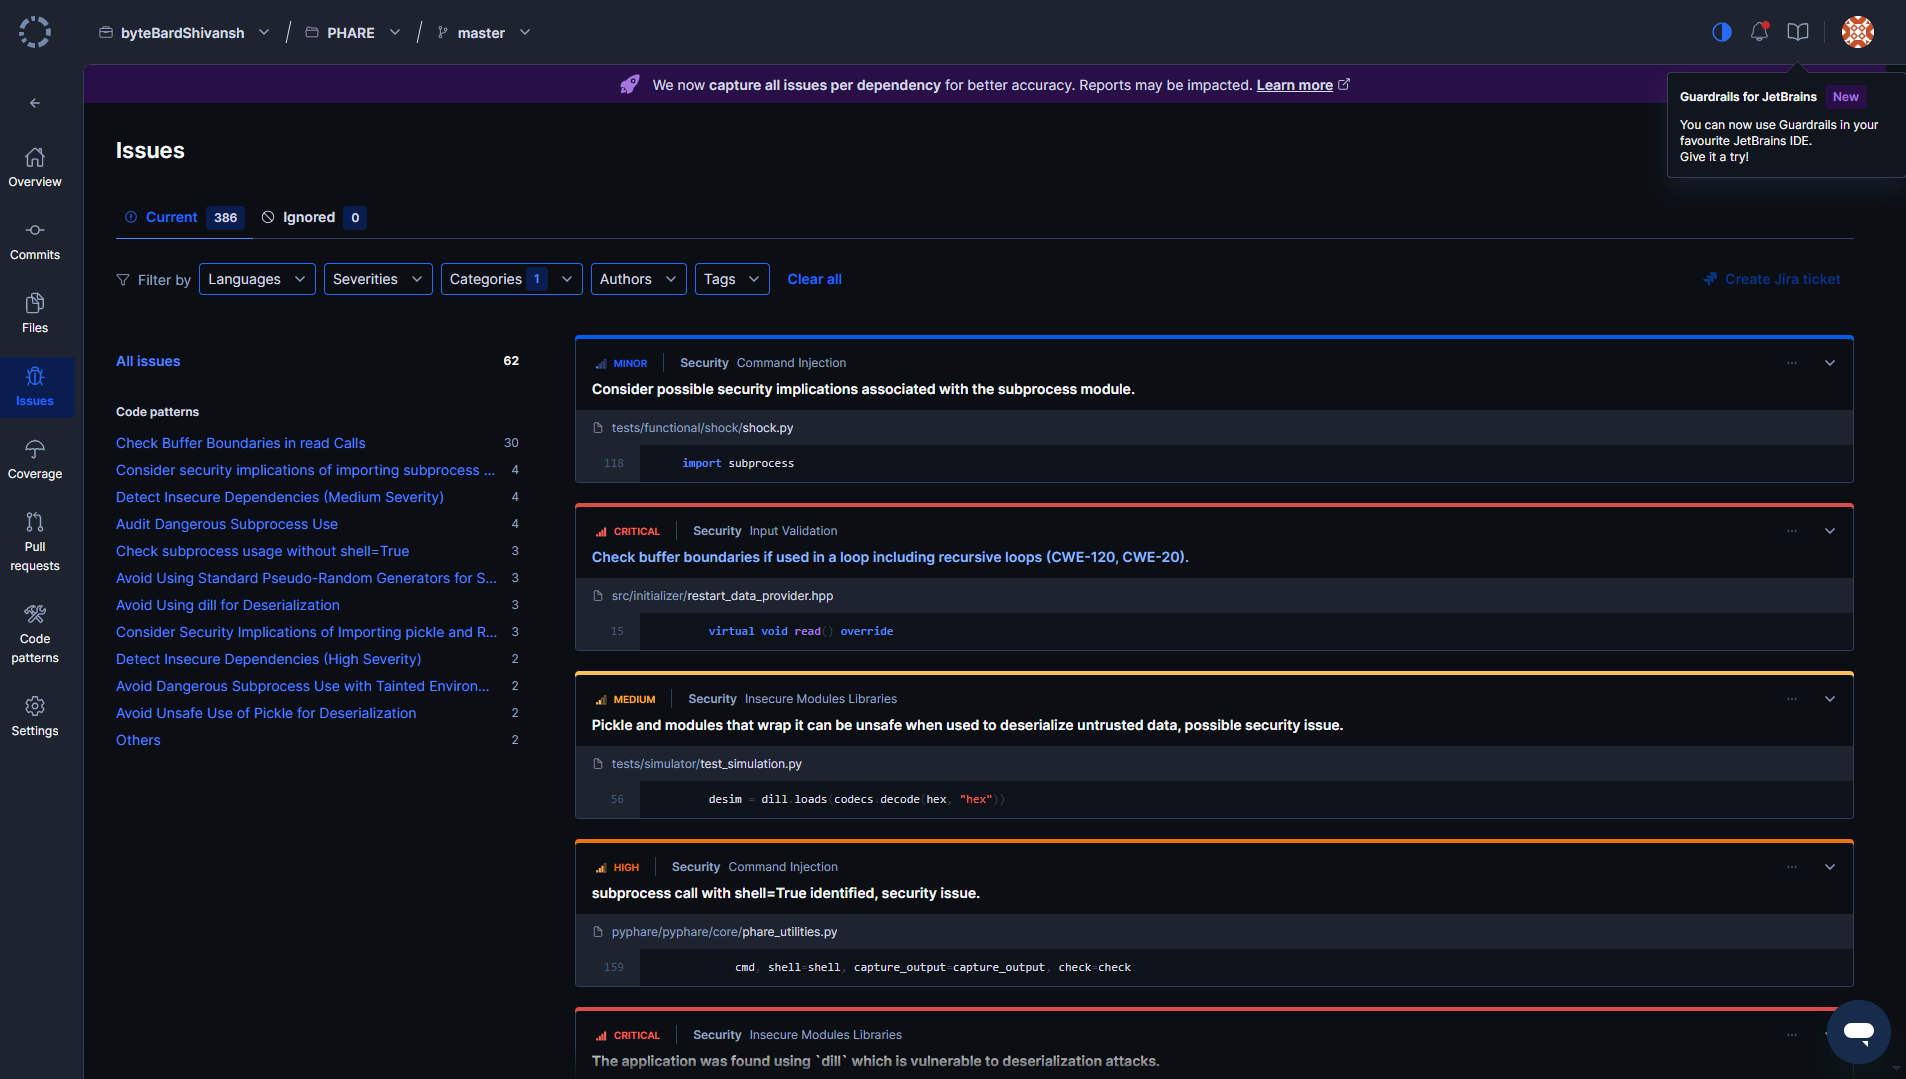
The first critical hit was in restart_data_provider.hpp. The read() override wasn’t doing proper buffer boundary checks, and Codeacy tagged it with CWE-120/CWE-20. That’s the sort of unchecked input that can lead to memory corruption if recursive loops aren’t capped.
In the Python code, the scan caught unsafe deserialization. Both pickle and dill.loads popped up in test_simulation.py, flagged because they can execute arbitrary code when given untrusted data. Those landed under medium severity, but they’re still worth cleaning out since test helpers often get copied into production utils.
The other big red mark was in phare_utilities.py, where a subprocess call had shell=True. Codeacy called it out as a high-risk command injection path. That’s an easy swap, replace it with subprocess.run using an arg list instead of relying on a shell.
Even minor issues like a bare import subprocess in shock.py showed up, more of a nudge to review usage than a blocker.
The scan basically laid out a to-do list:
- Fix the buffer handling in C++ first.
- Remove or hard-limit pickle/dill usage.
- Kill off shell=True in subprocess calls.
- Clean up the low-priority imports later.
Everything came with CWE tags and file/line context, so it was less about hunting and more about knocking items off in order.
Pricing
Codacy offers an open-source, free version for individuals and smaller teams. Paid plans start at $15/month, providing additional benefits such as advanced security scanning, enhanced reporting, and team collaboration features.
8. ReSharper

ReSharper is a fantastic tool, especially for .NET developers who want to enhance their productivity and improve code quality. It’s a powerful extension for Visual Studio IDE that provides valuable coding assistance, error detection, and quick fixes to keep code clean and efficient.
Pros
- Supports multiple languages: ReSharper can analyze code written in C#, VB.NET, XAML, ASP.NET, HTML, and XML, making it suitable for a wide variety of projects within the .NET ecosystem.
- Quick issue fixes: It offers quick-fix solutions that allow developers to address code issues and eliminate bugs or code smells almost instantly.
- Ensures code quality and compliance: ReSharper helps you maintain coding standards by identifying unused code and suggesting improvements for cleaner, more maintainable code.
- Automatic code generation: It includes helpful tools for automatically generating code, which can save time during development.
- IDE integration: Seamless integration with Visual Studio makes it easy to adopt and incorporate into existing development workflows.
- Free for open-source projects, students, and teachers: ReSharper offers a free version for open-source projects, students, and educators, making it accessible for learning and community contributions.
Cons
- Paid plans for advanced features: Although there is a free version, the full set of features is only available with a paid plan, which may not be ideal for smaller teams or solo developers on a tight budget.
- Visual Studio dependency: Since it’s an extension for Visual Studio, it’s limited to users working within that IDE, which may be restrictive for developers who use other tools.
Hands-on section
ReSharper running inside Visual Studio surfaces inline code-quality hints as you type. In ILParserTest.cs, the RelativeTestDataPath property is flagged with fixes like “To expression-bodied property” and the inspection “Use preferred body style.” Nullability analysis also shows “Can be null (conflicting)” vs “Not null (inherited)”, making intent explicit before changes land, as shown in the snapshot below:
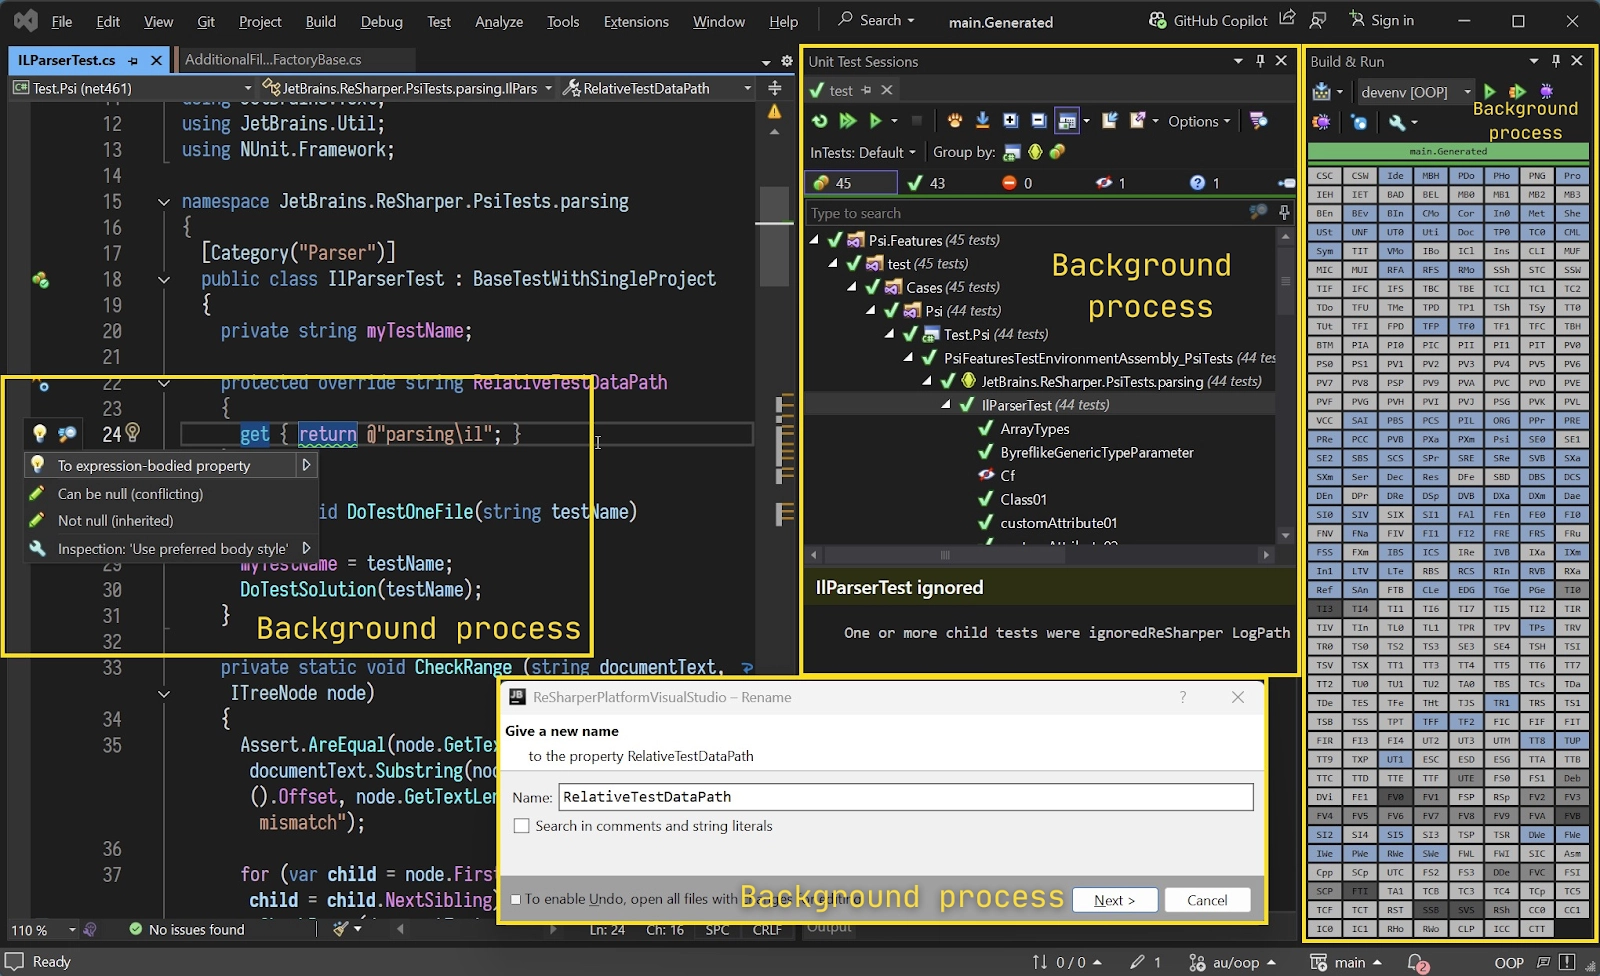
The refactor flow is safe and quick. The Rename dialog updates RelativeTestDataPath across the solution, with options to search comments and string literals, so stray references in test helpers don’t linger.
Unit tests are picked up by the built-in ReSharper Test Runner. The ILParserTest suite (44 tests) is discovered and grouped; a few tests are ignored due to a log-path mismatch, which is easier to catch here than in CI. Green checks on the rest confirm the refactor didn’t break parsing behavior.
All of this runs alongside background indexing and inspections. Even while Build & Run is active, ReSharper keeps showing gutter hints and quick-fixes without getting in the way.
Result: inline inspections drive small, correct refactors; rename is safe at solution scale; tests run locally with immediate feedback, reducing the chance of style and nullability nits or broken tests slipping into pull requests.
Pricing
ReSharper is free for open-source projects, students, and teachers. For others, paid plans start at $13.90/month, which provides access to the full suite of features tailored for organizations and individual developers.
9. Ox Security
Ox Security is an end-to-end software supply chain security platform that provides continuous visibility and control across the entire development lifecycle. It combines static code analysis (SAST), software composition analysis (SCA), infrastructure-as-code (IaC) scanning, and CI/CD posture management within a single interface. The goal is to identify and prevent vulnerabilities, misconfigurations, and supply chain risks before code reaches production.
Pros
- Unified security coverage: Consolidates SAST, SCA, IaC, and pipeline security into one workflow, reducing tool fragmentation.
- Accurate, contextual results: Correlates vulnerabilities across repositories, dependencies, and pipelines, minimizing false positives.
- Integrated remediation workflow: Provides direct fix suggestions through pull request comments or CI/CD feedback loops.
- Strong DevOps integrations: Works with GitHub, GitLab, Bitbucket, Jenkins, Azure DevOps, and major cloud providers (AWS, GCP, Azure).
- Policy enforcement: Allows teams to define rules that automatically block builds containing critical or policy-violating issues.
Cons
- Requires some setup effort for large multi-repo or multi-cloud environments.
- Advanced analytics and automation features are limited to enterprise plans.
Hands-on section
During testing, Ox Security’s unified dashboard provided a clear overview of repository-level and pipeline-level risks.
The Issues Status & Prioritization panel summarized the current exposure across 13 repositories, showing 86 total findings, categorized as 4 High, 4 Medium, and the remainder low-severity informational alerts.
Of the 111 original alerts, Ox’s aggregation and prioritization logic consolidated them into 59 actionable findings, further reducing them to 8 top-priority issues, highlighting effective deduplication and correlation across sources. As shown in the snapshot below:
As shown in the dashboard below:
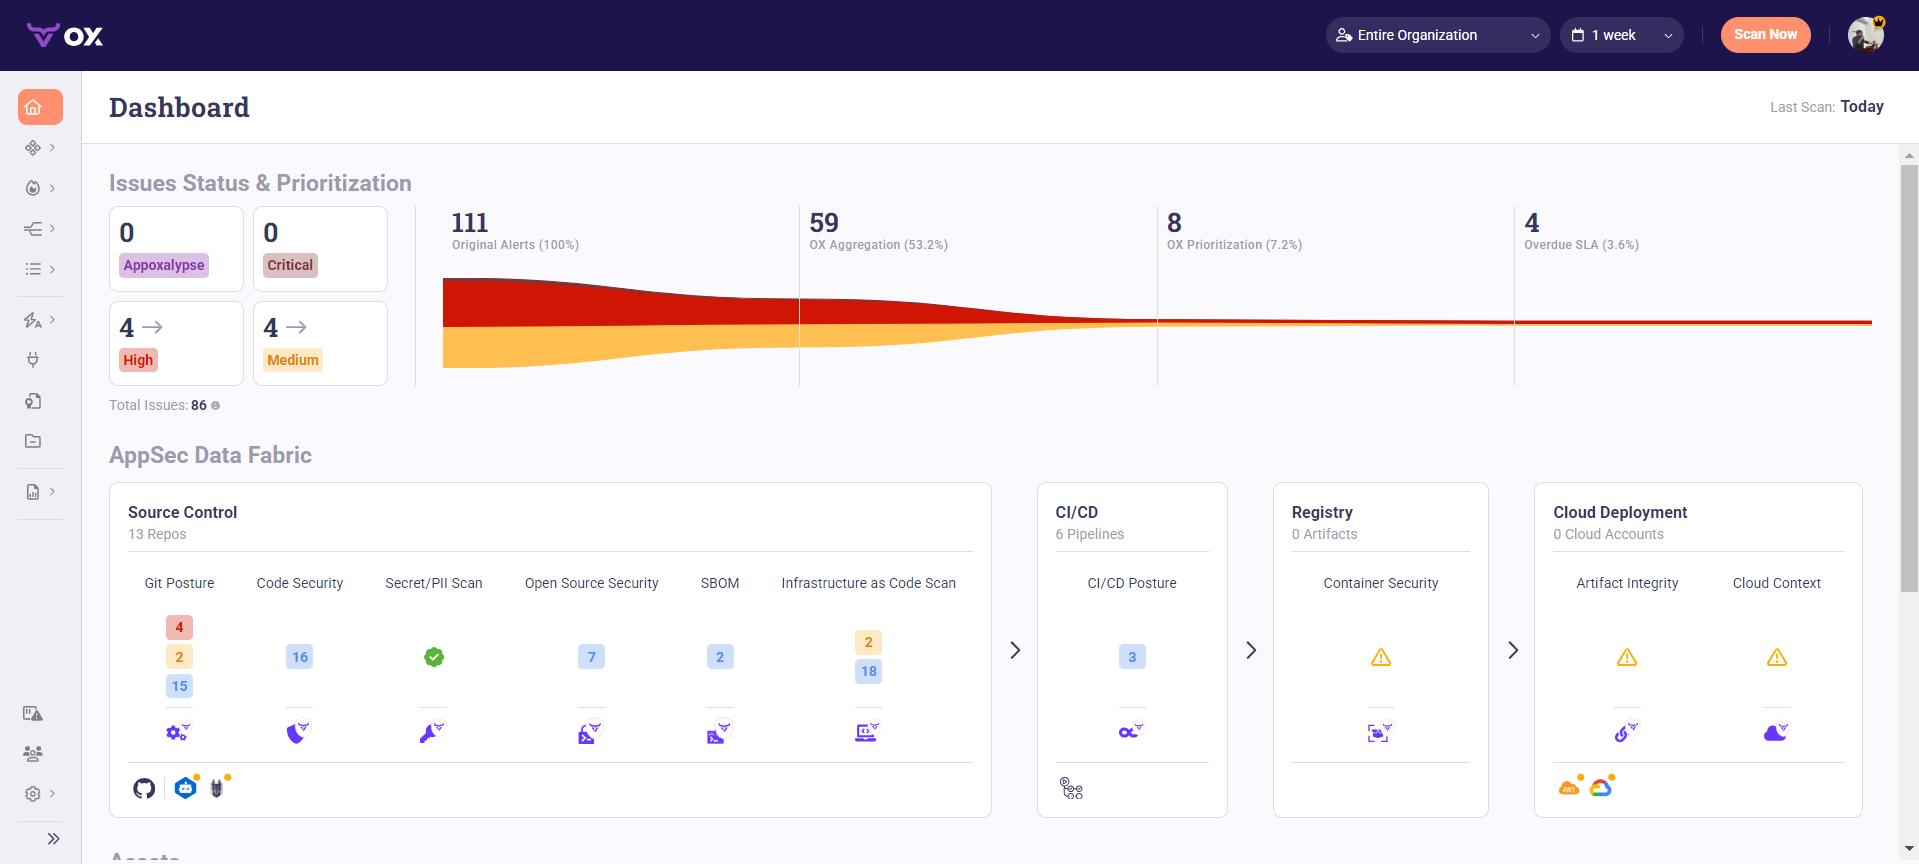
In the AppSec Data Fabric view, Ox broke down posture by security domain:
- Source Control: 16 code security alerts, 7 open-source dependency risks, and 2 IaC misconfigurations.
- CI/CD: 3 posture issues detected across six pipelines.
- Registry and Cloud Deployment: No active artifacts or accounts, but warnings were raised for missing artifact integrity and cloud-context validation.
Drilling into the Active Issues screen revealed specific examples, such as:
- High severity: “License file missing from public repo” and “Security Policy missing from public repo,” both flagged under Git Posture.
- Medium severity: “GCP storage bucket has no uniform bucket-level access” and “GCP storage bucket does not have logging enabled,” identified under Infrastructure-as-Code Scan.
Each record displayed SLA status (two months overdue for high-severity issues), owning application (byteBardShivansh/svc-prod), issue owner, and exploitability metrics.
Selecting an issue opened a detailed summary tab as shown below:
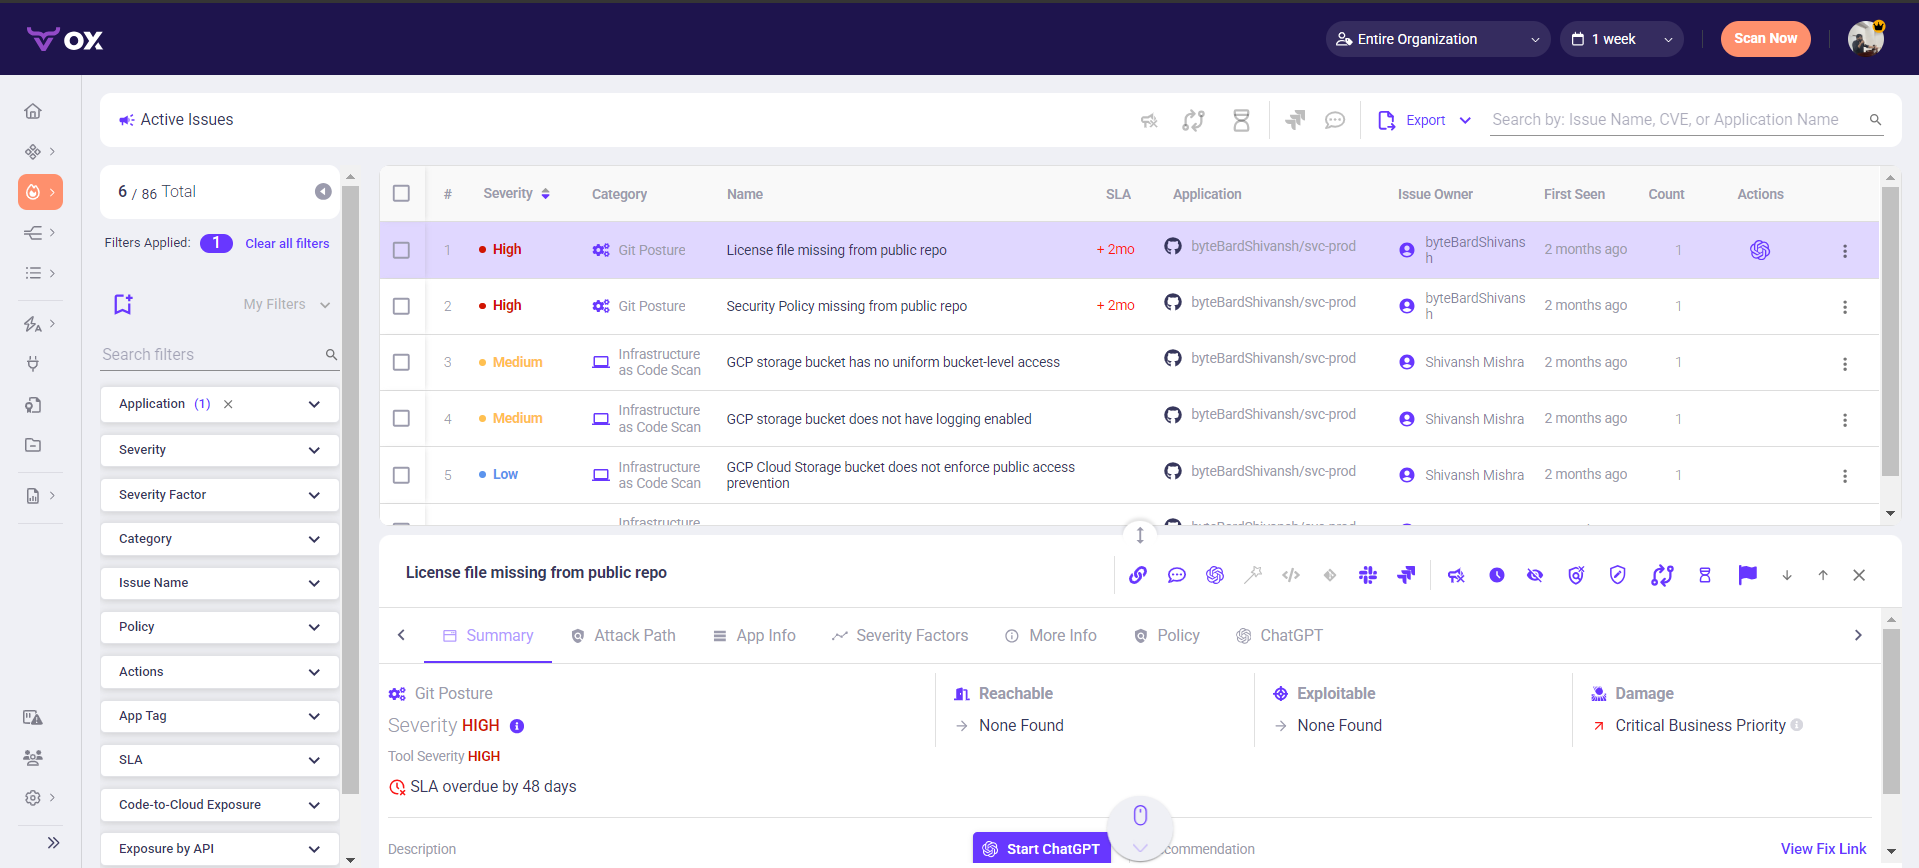
Linking the problem to its attack path, severity factors, and fix recommendations. For the IAM-related misconfigurations, Ox provided inline remediation text suggesting policy tightening, such as replacing wildcard (*) permissions with resource-specific constraints, along with a “View Fix Link” to generate a pull request automatically. The integration of ChatGPT-powered recommendations inside the issue panel further assisted in drafting secure replacements for missing policy or license files.
The overall workflow demonstrated Ox’s focus on context-driven aggregation rather than raw alert volume. By mapping findings from code, pipelines, and IaC templates into one prioritized view, the platform allowed teams to resolve the most critical governance and configuration gaps first, directly from within their development environment.
Pricing
Ox Security offers custom pricing based on organization size and integration depth. Enterprise subscriptions typically start in the low tens of thousands (USD) annually, with expanded automation, analytics, and policy features available in higher tiers.
10. Qodana
Qodana is JetBrains’ static code analysis tool designed to help development teams maintain clean, secure, and efficient code. It supports multiple languages and integrates seamlessly into CI/CD pipelines, making it a solid choice for teams focused on high-quality software.
Pros
- Broad language support: Works with over 60 languages, including Java, JavaScript, TypeScript, PHP, Kotlin, Python, Go, and C#.
- Advanced code analysis: Detects complex issues like null pointer dereferences, resource leaks, and duplicate code.
- Security-focused inspections: Taint analysis helps prevent vulnerabilities like SQL injection and cross-site scripting.
- CI/CD integration: Seamlessly connects with GitHub Actions, GitLab, TeamCity, Jenkins, Azure DevOps, and Docker.
- Automated quick fixes: Speeds up development by providing instant solutions to detected issues.
Cons
- Can be overwhelming for beginners due to the number of inspections.
- Some custom configurations require additional setup.
Hands-on section
Running a taint analysis with Qodana on a PHP demo project surfaced 29 actual problems right away. The dashboard kept it clean, baseline set at zero, so every issue stood out as fresh.
One part of the scan highlighted the project dependencies as shown in the snapshot below:
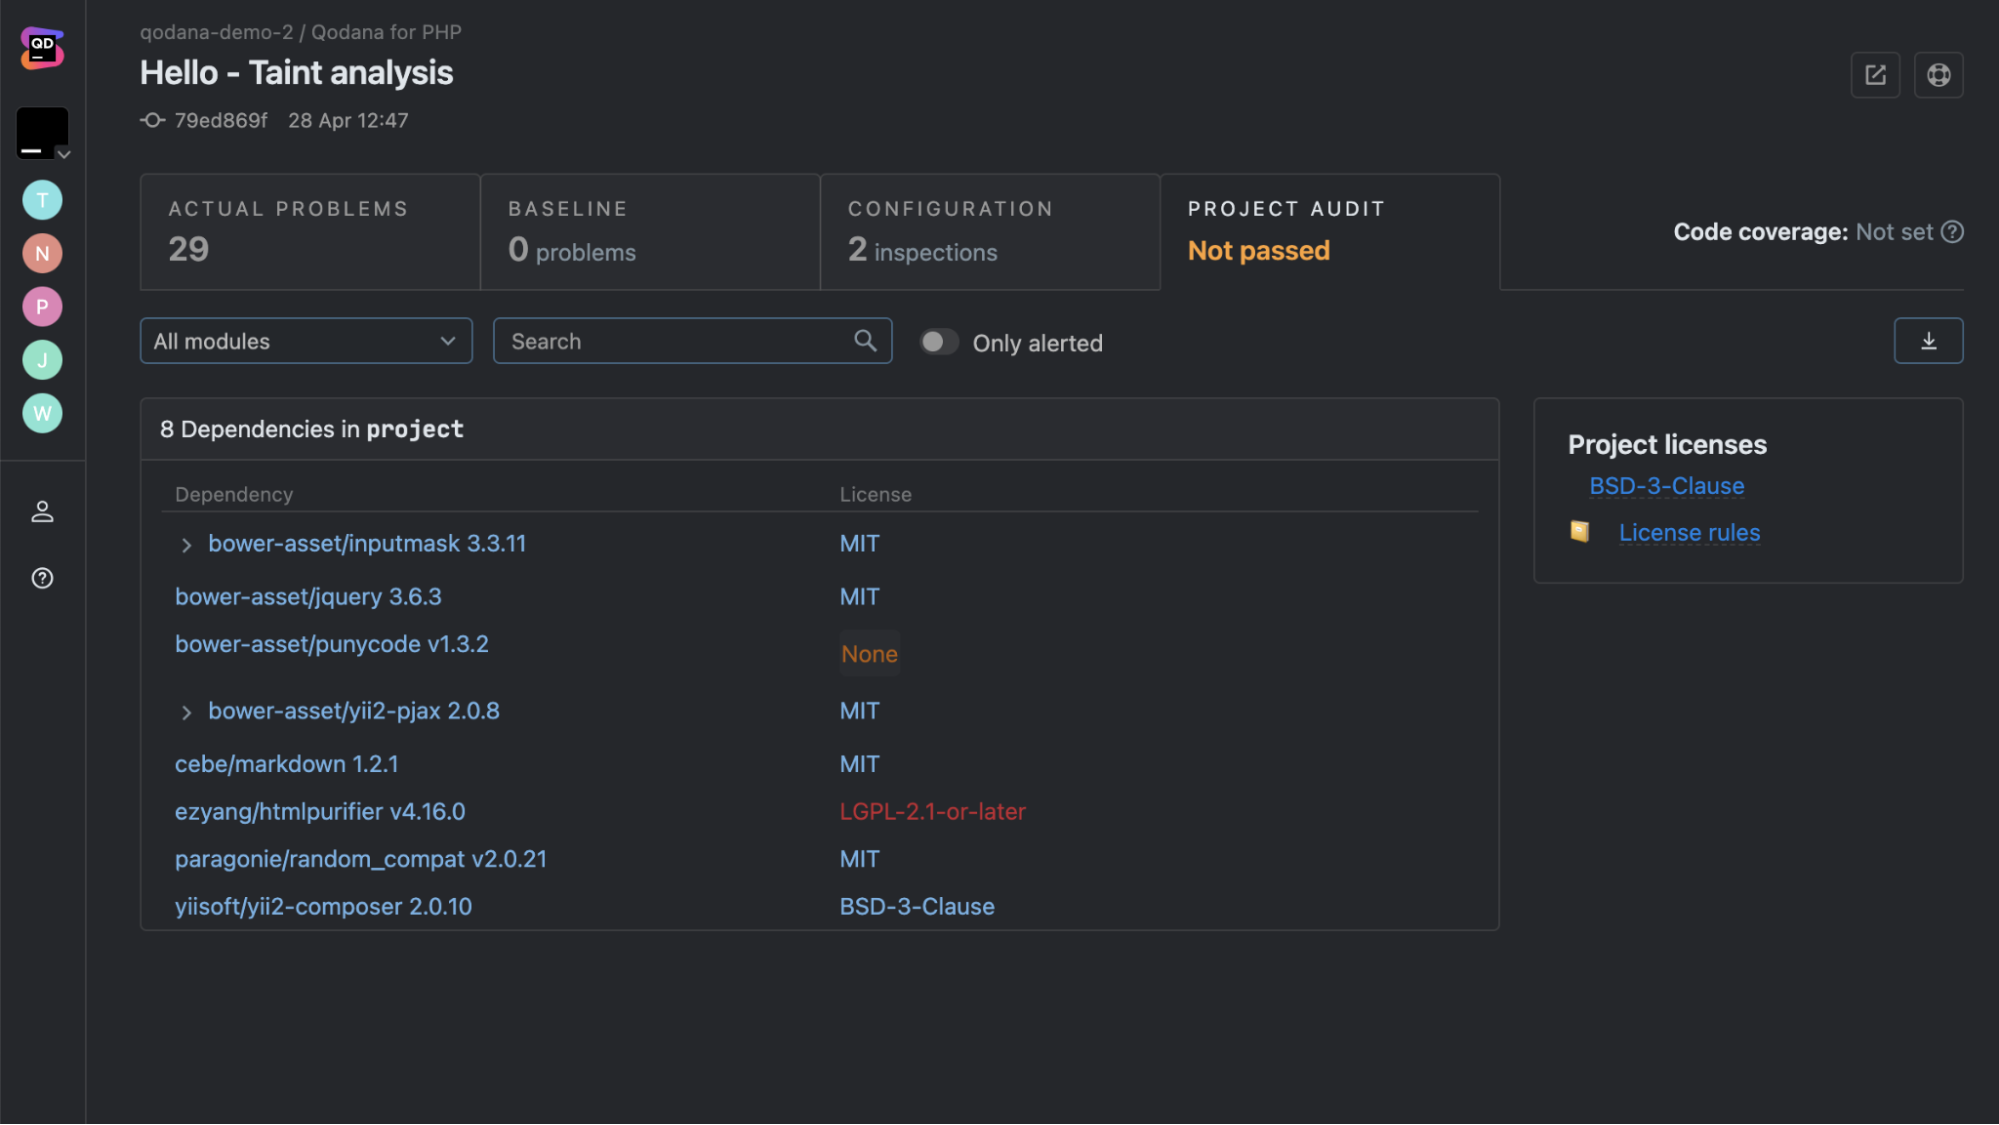
Out of the 8 libraries in play, most were under permissive licenses like MIT or BSD-3-Clause, but a few raised eyebrows:
- punycode v1.3.2 showed up with no license metadata, which is always a red flag when checking compliance.
- htmlpurifier v4.16.0 carried an LGPL-2.1-or-later license, which can create friction in certain enterprise distribution models.
Qodana didn’t just stop at licenses; it tied the problems back into a project audit status, marking it as Not Passed. That gave a clear signal that this build wasn’t compliant under the current rules.
What worked well here was the context: every dependency was listed with version, license, and links to project-wide license rules. Instead of digging through package manifests, the scan surfaced the compliance gaps right in the dashboard.
Takeaway: the Qodana run wasn’t just about code smells; it doubled as a governance check. Between missing licenses and restrictive copyleft flags, the tool made it obvious what would block a project from passing policy audits.
Pricing
The Qodana community plan is free, while the paid plan begins at $5.00 per active contributor per month.
11. Snyk
Snyk is a powerful developer security platform designed to detect and fix vulnerabilities in your code in real time. It integrates seamlessly with Git repositories, allowing developers to prioritize and address security issues across multiple projects.
Pros
- Real-time code scanning: Continuously analyzes your code for security vulnerabilities while you work.
- AI-powered fixes: DeepCode AI suggests quick fixes that can be implemented instantly within your IDE.
- Risk-based prioritization: Assigns risk scores to vulnerabilities, helping developers focus on the most critical issues.
- Container scanning: Checks for vulnerabilities in container images to ensure secure deployments.
- Live code tracking: Monitors code in real time, even when away from the development environment.
- Seamless CI/CD integration: Works with Jenkins, Azure Pipelines, and Bitbucket Pipelines.
- IDE support: Compatible with Eclipse, PhpStorm, Visual Studio, and other development tools.
Cons
- The free plan is limited to 100 tests per month.
- Scan times can be slower compared to some alternatives.
Hands-on section
Running Snyk Code on the PHARE repo, the first thing that popped up was a set of medium-severity issues around unsafe input handling. The dashboard gave me a clean view, as shown below:
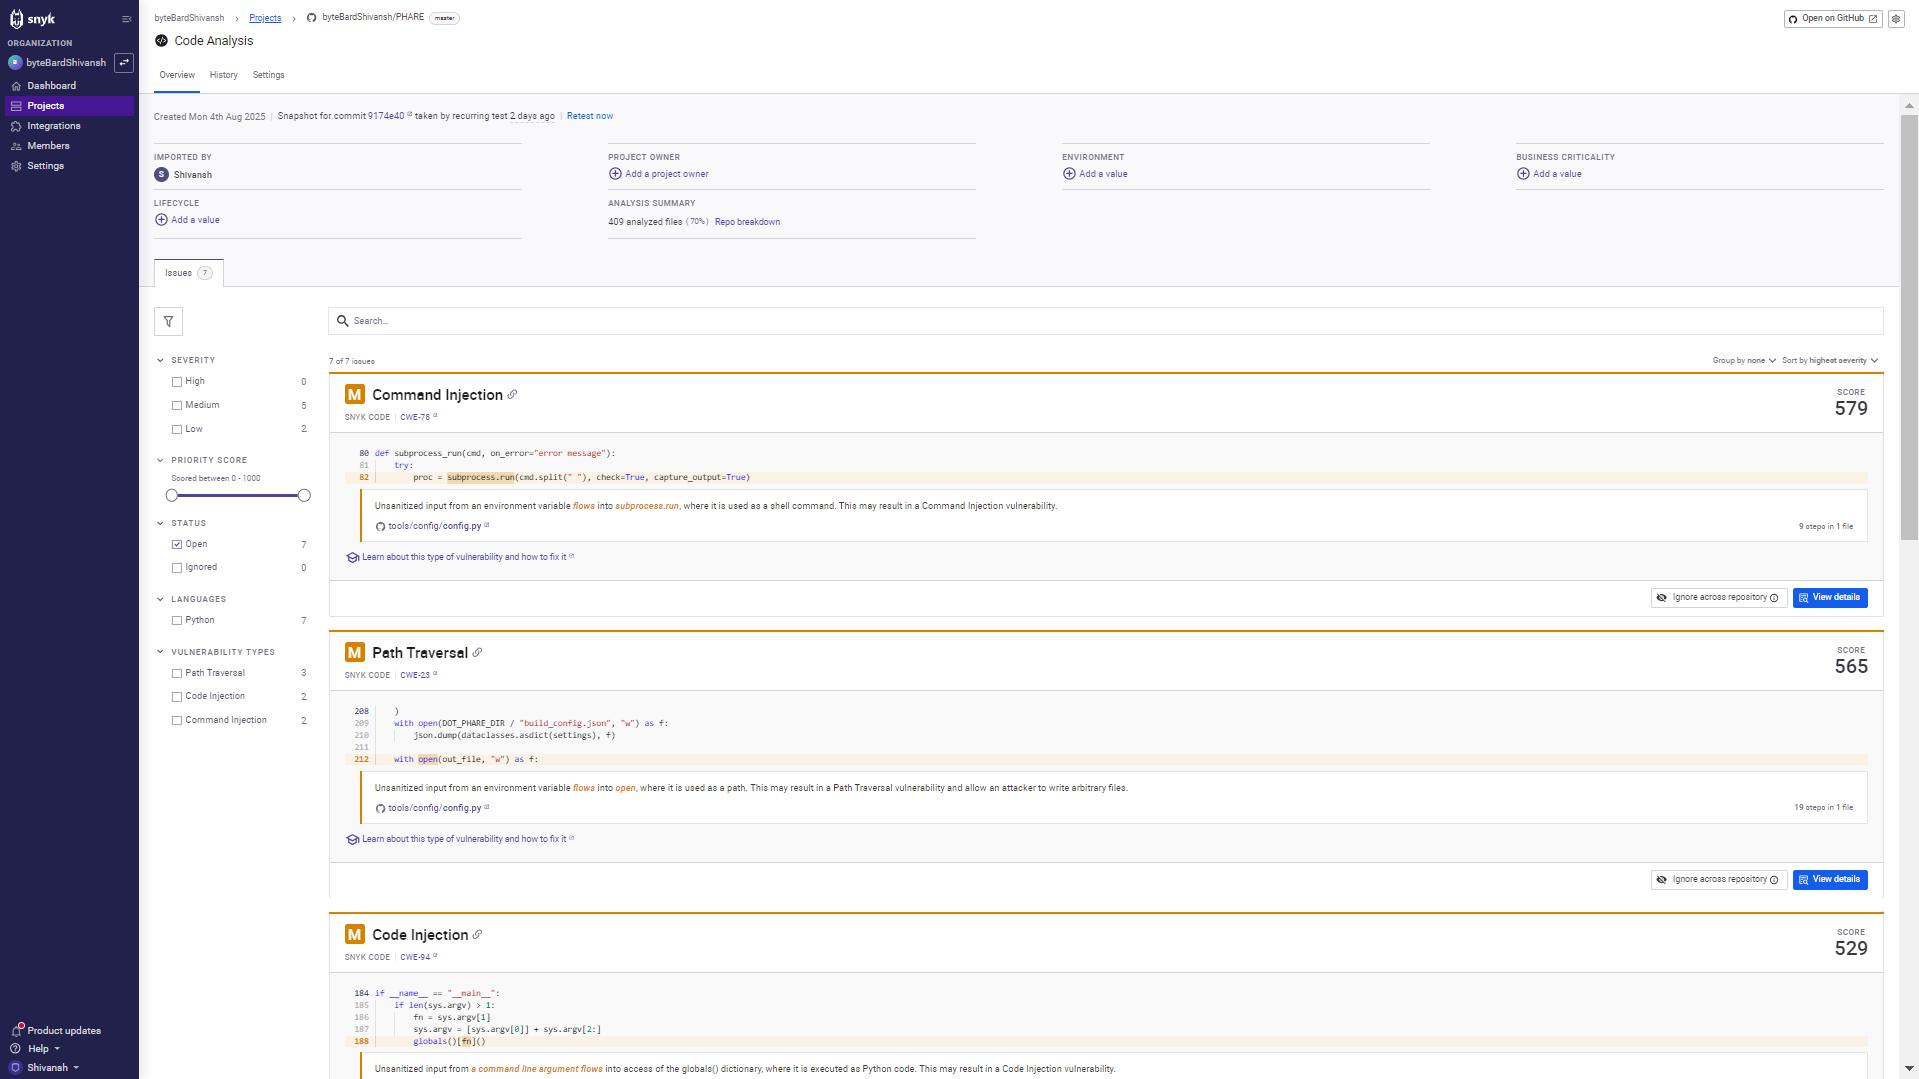
Each problem was tied to a CWE, a priority score, and the exact line in the source. No guessing.
The nastiest one was a command injection. One of the functions used subprocess.run with input pulled directly from an environment variable. Since it was piped straight into a shell command with check=True and capture_output=True, Snyk flagged it as CWE-78. That’s basically a free ticket for anyone to inject arbitrary commands. The fix wasn’t complicated: validate the input or just avoid invoking the shell in the first place.
Next, a couple of path traversal issues. In one place, open was called with a path built directly from an environment variable. No sanitization, no checks. The scanner showed how that could let someone escape the intended directory and write wherever they want. CWE-23, classic path traversal. The guidance was clear: normalize the path and lock it down.
There was also a code injection red flag. A section of code dropped raw command-line args into globals() and executed them as Python. That’s CWE-94 territory, and it basically means an attacker could ship in any payload and get it executed.
What I liked was the scoring system. Command injection came in at 579, path traversal at 565, and code injection at 529. Having those numbers made it easy to triage instead of treating everything as equally urgent. And each issue linked directly to docs and safer alternatives, so fixing wasn’t a guessing game.
Takeaway: one scan caught three different injection vectors, all rooted in unvalidated inputs. The trace and context made it obvious what needed sanitization and what could be swapped out for safer APIs. It didn’t feel like generic security noise; it actually pointed me to risky code that needed attention.
Pricing
The Free plan is for individuals and small teams, while the Team plan, starting at $25 per month, is designed for development teams focusing on security integration.
12. Aikido Security
Aikido Security is a DevSecOps platform designed to enhance security across both codebases and cloud environments. It provides developers with a comprehensive toolset to identify and mitigate security vulnerabilities early in the development process, ensuring robust protection against potential threats.
Pros
- Advanced static code analysis: Identifies security flaws in the source code, including injection attacks and buffer overflows.
- Integrated open-source & proprietary scanners: Uses a mix of trusted open-source scanners (Bandit, Semgrep, Gosec) and Aikido’s own tools for enhanced accuracy.
- Cloud security posture management (CSPM): Monitors and detects risks in cloud infrastructure across AWS, Google Cloud, and Azure.
- Secrets detection: Prevents unauthorized access by scanning for exposed API keys, passwords, encryption keys, and other sensitive credentials.
- Extensive integrations: Connects seamlessly with AWS, Google Cloud, Azure, Docker Hub, Jira, and GitHub.
Cons
- English language only.
- Ignores vulnerabilities if no immediate fix is available.
Hands-on section
After wiring up the payment-api repo, Aikido ran a scan and surfaced a single high-severity issue:
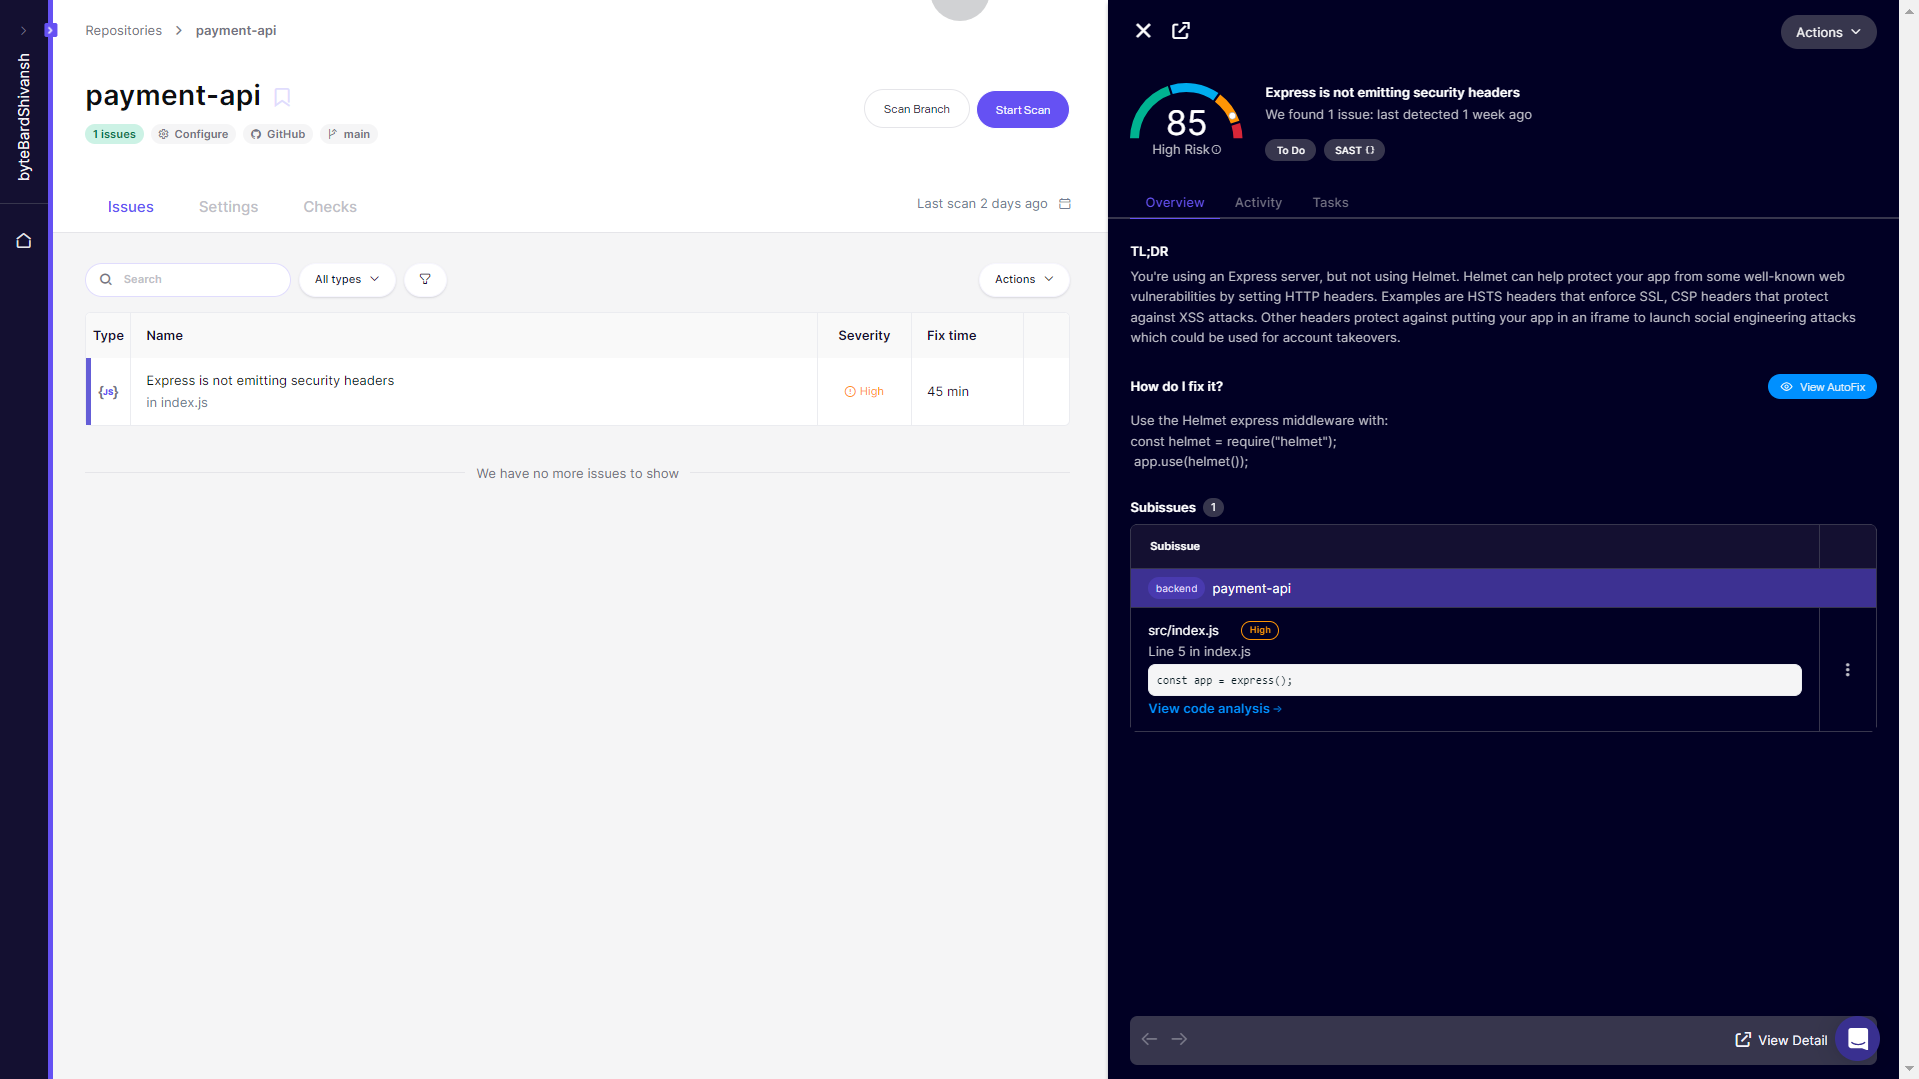
The analyzer zeroed in on line 5, where the app bootstraps with const app = express(); and flagged the absence of standard HTTP security headers. The fix suggestion was direct: drop in helmet, the standard Express middleware for setting HSTS, CSP, and other protective headers.
Aikido’s panel even estimated fix time (45 minutes) and showed the TL;DR right in the UI: without these headers, the service is vulnerable to common XSS vectors, clickjacking, and content injection risks.
What I liked was the code-context view on the right: it mapped the finding straight back to the source file, marked the exact line, and explained why it matters in practical terms (e.g., protecting against account takeover via iframe injection). The “AutoFix” option was also there, but I opted to patch manually to confirm everything played well with the existing middleware stack.
After adding helmet() and re-running the scan, the issue cleared, leaving the repo green across Aikido’s checks. Simple, targeted, and actionable.
Pricing
The free plan is available for developers and curious minds with up to 2 users, while the $360/month plan includes 10 users at $36 per user/month and is designed for small teams to cover the basics.
13. Code Climate Quality
Code Climate Quality is a static code analysis tool designed to help development teams improve code quality and maintainability. It supports multiple programming languages, including PHP, Java, JavaScript, Python, and Ruby, providing insights to streamline development workflows and reduce technical debt.
Pros
- Technical debt assessment: Grades code maintainability from A to F, providing clear insights into technical debt.
- Issue resolution estimates: Calculates the estimated time required to fix identified problems, improving project planning.
- Multi-language support: Works with PHP, Java, JavaScript, Python, Ruby, and more.
- Seamless integrations: Connects directly with GitHub, GitLab, and tools like Asana, Trello, and Slack for workflow automation.
Cons
- Free plan has limited features.
- May generate false positives, requiring manual review.
Hands-on section
The first thing I did was connect my repositories to the Qlty dashboard. Once synced, each project showed up with quick health grades for Security, Maintainability, Coverage, and Duplication as shown in the snapshot below:
This overview was useful to spot trouble at a glance:
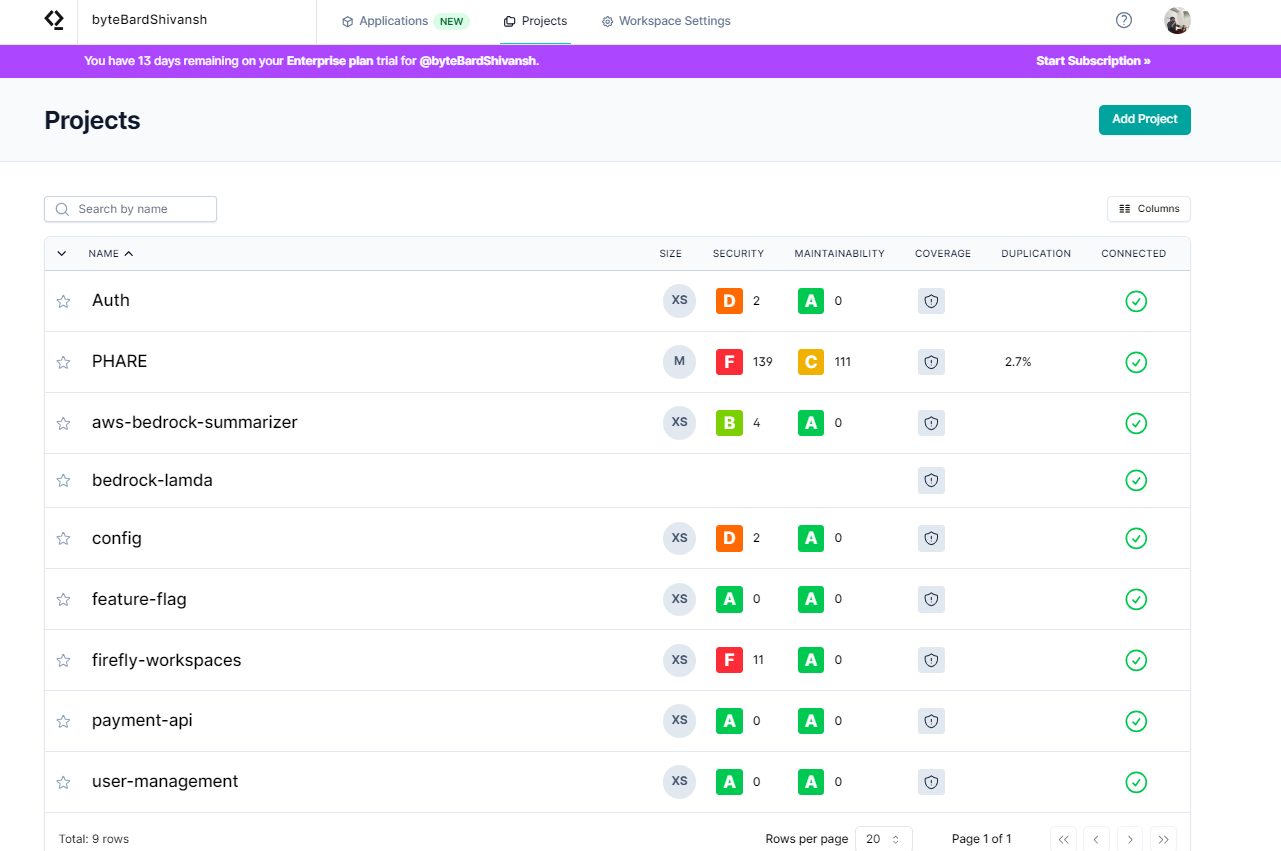
- Auth looked solid with an A in maintainability and 0 issues.
- PHARE immediately showed F in Security (139 issues) and C in Maintainability (111 warnings).
- Other services like aws-bedrock-summarizer and firefly-workspaces had smaller but notable red flags.
With that, I scanned PHARE to see what the analyzer picked up.
As shown in the snapshot below:
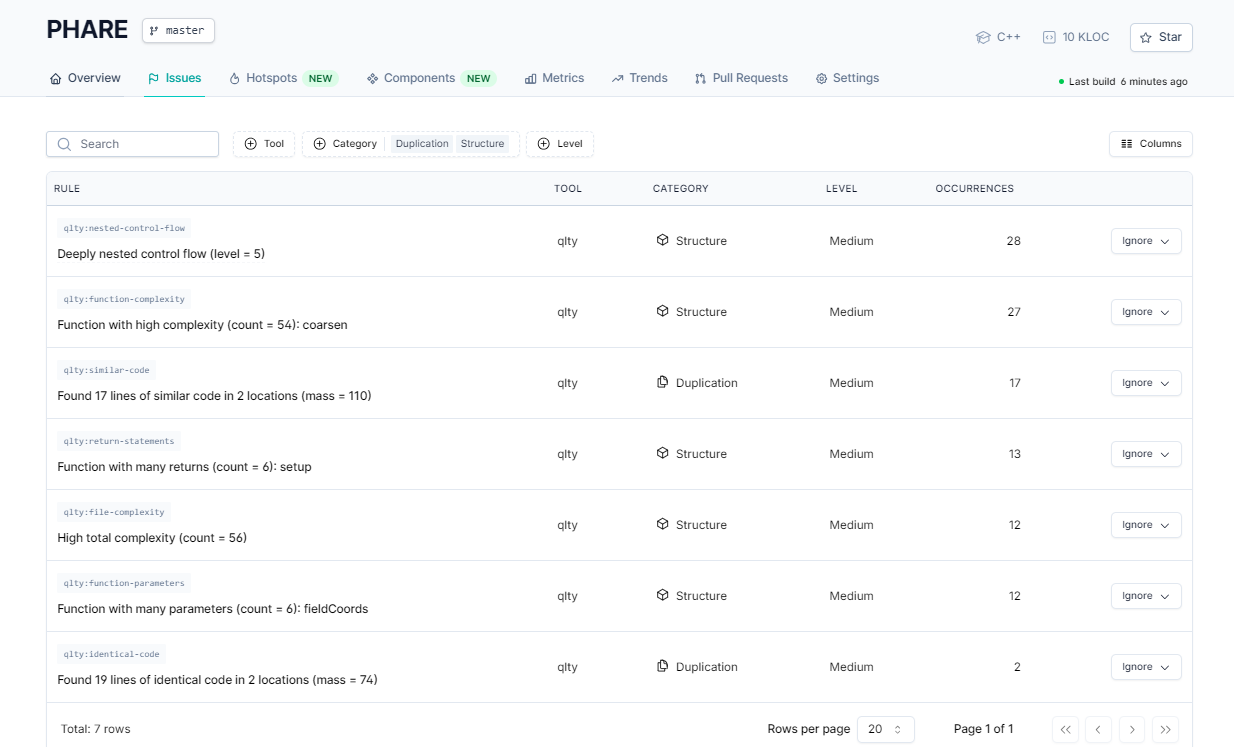
Inside PHARE, the issues were broken down by structural and duplication checks:
- Deeply nested control flow (level = 5) flagged 28 times.
- High complexity functions (e.g. coarsen() with complexity count = 54).
- Duplicated code blocks, like 17 identical lines across 2 locations.
- Functions with too many returns (6 in one function) and too many parameters (6 in fieldCoords).
- File-level complexity is topping out at 56 in some modules.
On the project overview page below:
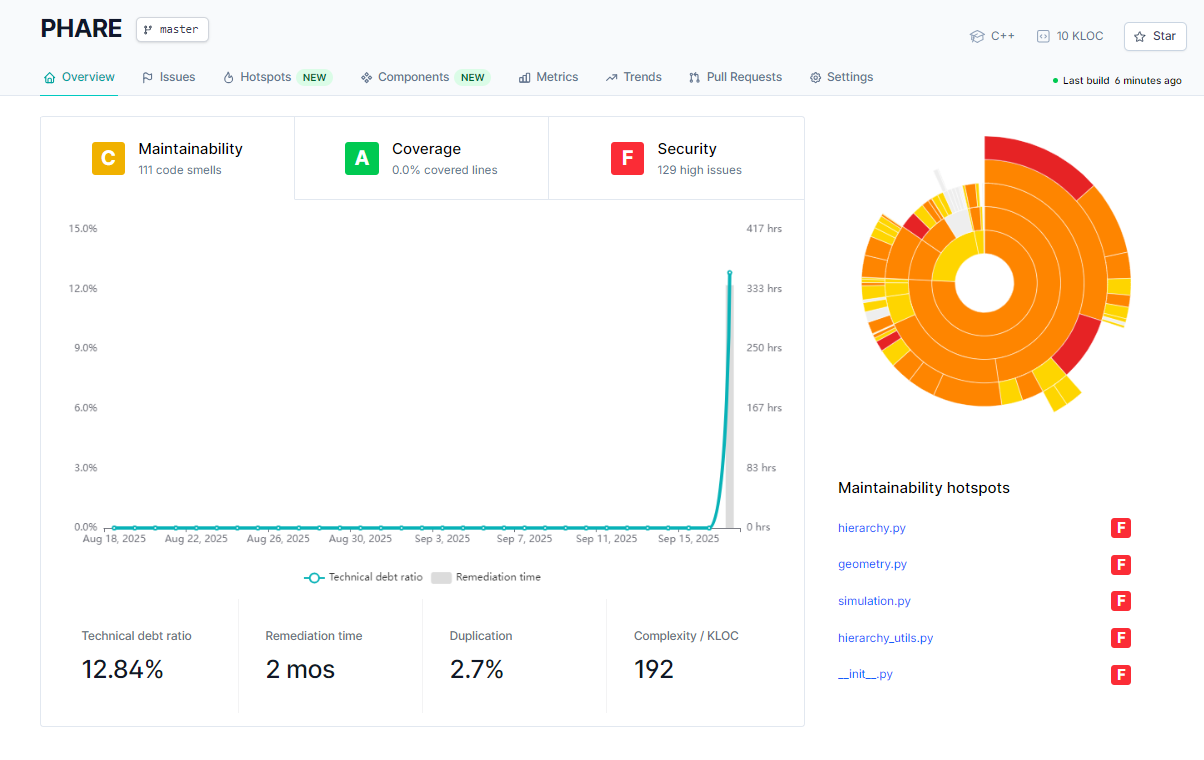
Qlty wrapped these findings into higher-level metrics:
- Maintainability: C → 111 code smells.
- Coverage: A → though showing 0% covered lines (uncovered files simply weren’t counted).
- Security: F → 129 high-severity issues.
- Technical debt ratio: 12.84% with ~2 months remediation time.
- A sunburst hotspot chart highlighted hierarchy.py, geometry.py, and simulation.py as the worst offenders, each tagged with an F.
The combination of the dashboard view for prioritization and the drilldown for detail made it clear: PHARE needs immediate fixes to the red security issues, followed by incremental refactoring of complexity and duplication hotspots.
Pricing
The Open-Source plan is free with unlimited public repositories, the Startup plan is free for up to 4 seats with unlimited private repositories, and the Team plan costs $16.67 per seat/month.
Feature and Integration Comparison of 13 Static Code Analysis Tools
Here’s a quick overview of the 13 tools, summarizing the above detailed comparison in a simple table format:
| Tool | Category | Language/Scope | Integrations (examples) | Standout Strength |
| Qodo | Security-focused SAST / AI PR assistant | Python, JS/TS; JetBrains + VS Code IDEs | Git integration, PR workflows | Actionable PR comments + auto unit tests |
| PVS-Studio | General-purpose analyzer | C, C++, C#, Java | IDEs, CI/CD, build systems | High-signal rules; enterprise workflows |
| ESLint | Language-specific | JavaScript/TypeScript | VS Code, IntelliJ, CI | Fast hygiene & consistency |
| SonarQube | General-purpose + SAST | 30+ languages/frameworks | DevOps/CI, dashboards | Strong CI Quality Gates & taint analysis |
| Fortify SCA | Security-focused SAST (with DAST in suite) | 35+ languages | Jenkins, Jira, Azure DevOps, Eclipse, VS | Enterprise-grade coverage & compliance |
| Coverity | Language-specific (broad) | Java, JS, C/C++, C#, Ruby, Python | GitHub/GitLab/Jenkins; IDE plugins | Precise root-cause traces |
| Codacy | General-purpose + security | Multi-language (JS/TS, C++, etc.) | GitHub/GitLab/Bitbucket, Jira | Clear repo health dashboards |
| ReSharper | Language-specific (.NET) | C#, VB.NET, XAML, ASP.NET, etc. | Visual Studio | Deep .NET IDE assistance |
| Ox Security | End-to-end supply chain security (SAST, SCA, IaC, CI/CD posture) | 25+ languages, multiple frameworks | GitHub, GitLab, Bitbucket, Jenkins, Azure DevOps, major clouds | Unified scanning, contextual remediation, strong policy enforcement |
| Qodana | Language-specific / General (JetBrains) | 60+ languages | GitHub Actions, GitLab, TeamCity, Jenkins, Azure, Docker | Tight JetBrains/CI integration |
| Snyk | Developer-focused security | App code + containers | Jenkins, Azure Pipelines, Bitbucket; IDEs | Developer-first UX, risk-based triage |
| Aikido Security | Developer security suite | App code + cloud (AWS/GCP/Azure) | GitHub/Jira/Docker/Clouds | Clear, actionable fixes (e.g., headers/helmet) |
| Code Climate Quality (Qlty) | General-purpose quality | PHP, Java, JS, Python, Ruby, more | GitHub/GitLab; Asana/Trello/Slack | Grades + debt/time estimates; hotspot views |
Now that we’ve compared the tools, let’s focus on how static code analysis is managed in large-scale enterprises. With multiple repositories, varied workflows, and strict security requirements, maintaining code quality and compliance becomes complex. Choosing the right tool that integrates seamlessly and scales with these needs is crucial for enterprise teams. Let’s dive into how static code analysis works in these scenarios.
Managing Static Code Analysis in Large-Scale Enterprises
In enterprise-level software development, managing codebases comes with unique challenges. As teams work in multiple repositories, each with different access controls, some with a contributor and some with a reviewer, branching strategies, and CI/CD workflows, ensuring consistent quality, security, and performance becomes a monumental task itself. This is especially important in industries where security and compliance are important.
Here are the key operational requirements that enterprises face in static code analysis:
- Multiple Repository Code Analysis: With multiple repositories in use, manually analyzing code across them can be time-consuming and error-prone. Enterprises need tools that allow them to efficiently search, index, and analyze code across various platforms like GitHub, GitLab, and Bitbucket, while respecting repository-specific permissions.
- Version Control System Integration: Static code analysis tools must seamlessly integrate with version control systems, ensuring that access controls, branching strategies, and deployment pipelines are maintained at every stage of development.
- Scalability and Performance: For large codebases, performance is crucial. Static analysis tools must handle indexing efficiently to provide quick search results and facilitate real-time analysis without compromising accuracy or speed.
- Security and Compliance: Enterprises often deal with sensitive or regulated data. Static analysis tools must support on-premises deployment, enforce strict access controls, and comply with internal auditing and regulatory requirements, ensuring that security and compliance needs are met.
- Seamless Workflow Integration: Integration with existing workflows is vital for smooth operations. Static code analysis tools need to integrate with CI/CD pipelines, issue trackers, and internal dashboards to automate checks, generate reports, and provide actionable insights within the broader development process.
This is where Qodo stands out for enterprise-level static code analysis. Qodo’s enterprise solutions are designed to simplify the analysis process while addressing the specific requirements of large-scale teams. With seamless platform integrations, AI-driven insights, and robust security features, Qodo helps enterprise teams maintain high-quality, secure codebases without compromising on compliance.
Key Enterprise Features of Qodo:
- Repository Analysis: Qodo enables teams to search and analyze code across all repositories, simplifying the identification of issues, understanding of dependencies, and evaluation of the impact of changes across the entire codebase.
- Smart, Scalable Integration: Qodo integrates seamlessly with popular version control systems and CI/CD pipelines, ensuring smooth workflows while maintaining access controls and permissions.
- Advanced Security & Compliance: With support for SOC2 compliance and on-premise deployments, Qodo ensures that sensitive data remains secure and compliant with regulatory standards.
- Performance Optimization: Qodo optimizes indexing and caching, ensuring that large codebases are analyzed efficiently and that actionable insights are delivered in real-time, without unnecessary delays.
- Actionable Recommendations: Qodo provides AI-driven insights that not only identify issues but also offer actionable recommendations, helping teams resolve problems before they reach production.
In conclusion, managing static code analysis at scale in an enterprise requires a solution that integrates into existing workflows, supports strict compliance needs, and handles large, complex codebases efficiently. Qodo is built to meet these demands, offering intelligent, scalable, and secure code analysis that helps enterprise teams maintain high-quality and secure software.
Conclusion
Static code analysis tools go beyond basic linters. They provide deep, intelligent insights that help teams develop more robust, secure, and maintainable software. By integrating these tools into the development workflow, teams can systematically improve their code quality and reduce the likelihood of bugs and security vulnerabilities.
FAQs
What is Static Code Analysis?
Static code analysis is an approach that examines your code without executing it to identify any potential errors, violations of coding standards, and security vulnerabilities. Generally, static code analysis can find:
- Errors in the code (syntax, logic, etc.)
- Security vulnerabilities
- Issues with code quality
- Violations of coding standards and best practices
- Performance issues
To perform static code analysis, there are dedicated tools referred to as static code analysis tools (or static source code analysis tools). These tools are more professional than regular code analysis tools.
Unlike dynamic code analysis tools, these tools help you create a cleaner, enhanced, secure codebase that meets your quality goals and metrics with minimum bugs and errors.
How do static code analysis tools differ from dynamic analysis tools?
Static code analysis examines source code without executing it, identifying potential issues during the development phase. Dynamic analysis, in contrast, requires running the code to detect runtime problems. Static tools focus on code structure, potential bugs, and vulnerabilities before execution, while dynamic tools analyze the program’s behavior during actual runtime.
Can static code analysis tools help with security vulnerabilities?
Absolutely! Static code analysis tools are powerful security allies. They systematically scan code to detect potential security risks like SQL injection, cross-site scripting, and authentication vulnerabilities. These tools compare code against known security patterns and best practices, flagging potential weaknesses before deployment and helping developers proactively address security concerns.
What are the key benefits of using static code analysis tools?
Static code analysis tools provide multiple benefits: early bug detection, improved code quality, consistent coding standards, and reduced technical debt. They automate code reviews, identify potential performance issues, and help maintain code consistency across large teams. By catching problems early, these tools save development time, reduce debugging efforts, and enhance overall software reliability.
Can static code analysis tools replace manual code reviews?
While incredibly powerful, static code analysis tools cannot completely replace manual code reviews. They excel at detecting technical issues, coding standard violations, and potential vulnerabilities. However, they lack the nuanced understanding and contextual insights that human reviewers provide. The best approach combines automated static analysis with targeted, thoughtful manual code reviews.