How to Measure and Improve Developer Productivity On Your Team with AI
TL;DR
- AI now influences the earliest stages of development, but in organizations with more than 200 microservices, even small inaccuracies compound quickly. Drafting may speed up, yet productivity depends on how reliably work moves across services, reviewers, and environments, not on how fast code is generated.
- Enterprise teams working across GitHub, GitLab, and Azure DevOps often see velocity and story points remain stable while clarification work, retries, and fragmented fixes pile up quietly in the background engineering productivity..
- DORA metrics highlight deployment throughput, yet most friction appears earlier. Cross-team pull requests waiting in review, inconsistent expectations, and slow test cycles rarely come up in pipeline dashboards.
- The largest productivity losses accumulate in coordination gaps. Context switching across repositories, returning to work after review delays, and restating standards across dozens of teams steadily affect momentum.
- Productivity strengthens when code review friction drops across the organization. Smaller pull requests, shared expectations, and consistent quality criteria reduce cognitive load and improve flow across distributed teams.
- AI code review tools such as Qodo bring up complexity risks, missing tests, and repeated patterns early, allowing reviewers to focus on architectural decisions instead of re-identifying issues. This leads to more consistent quality across the entire SDLC.
Software development remains one of the few key business functions where productivity is still debated rather than measured. And since the use of AI has become a constant part of engineering workflows, the conversation has grown even more complicated. The 2025 Stack Overflow Developer Survey reported that nearly 7 in 10 developers rely on AI assistance for routine tasks, yet almost half said AI-generated code increases review time when suggestions contain hidden errors.
According to GitLab’s 2025 research, many teams adopt AI, but the productivity improvements are far from guaranteed: coding may go faster, yet tool-chain complexity, compliance friction, and coordination gaps often cancel out gain
Engineering leaders overseeing polyglot codebases across GitHub, GitLab, and Azure DevOps consistently report that productivity losses rarely originate in the implementation itself. The primary drag comes from cross-repo context switching, unclear ownership boundaries, and inconsistent review expectations tied to regulatory or internal standards. These issues compound when fifty or more distributed teams interpret guidelines differently, or when quality gates vary across environments.
The pattern becomes clearer at the organizational level: productivity shifts not with individual skill, but with system-wide clarity, governance confidence, and the predictability of review cycles.
Environments that enforce consistent standards, provide reliable tooling, and reduce redundant review effort maintain steadier throughput across the SDLC. Fragmented systems introduce friction that expands with scale, regardless of how experienced the teams are.
In this post, I outline how I measure developer productivity using a mix of quantitative metrics and qualitative signals that don’t feel invasive or performative. I’ll share mistakes, course corrections, and the changes that had the biggest impact.
The Problems With Measuring Developer Productivity Through Inputs
Many enterprises still rely on visible inputs such as hours logged or online activity to gauge productivity. These signals are easy to collect, yet they fail to reflect how work actually progresses in large, distributed engineering organizations. AI contributes to this gap: drafting may speed up, but teams spend additional time validating generated logic, resolving inconsistencies, and aligning suggestions with internal standards, none of which appears in time-based metrics.
For organizations managing polyglot codebases across GitHub, GitLab, and Azure DevOps, presence-based measurement creates misleading signals. Long hours can appear productive even when review delays, unclear ownership, or compliance checks slow actual throughput. AI widens the gap between visible activity and real progress because task duration no longer reflects risk, technical depth, or downstream impact across interconnected services.
Input-based systems also ignore the cognitive load and verification work required in large environments. Fatigue, cross-team coordination, and late-stage corrections introduced by AI suggestions all accumulate silently.
For engineering leaders enforcing standards across fifty or more distributed teams, these blind spots make it difficult to understand how reliably work moves through the SDLC. A more accurate approach evaluates quality and predictability of outputs, not the duration of activity around them
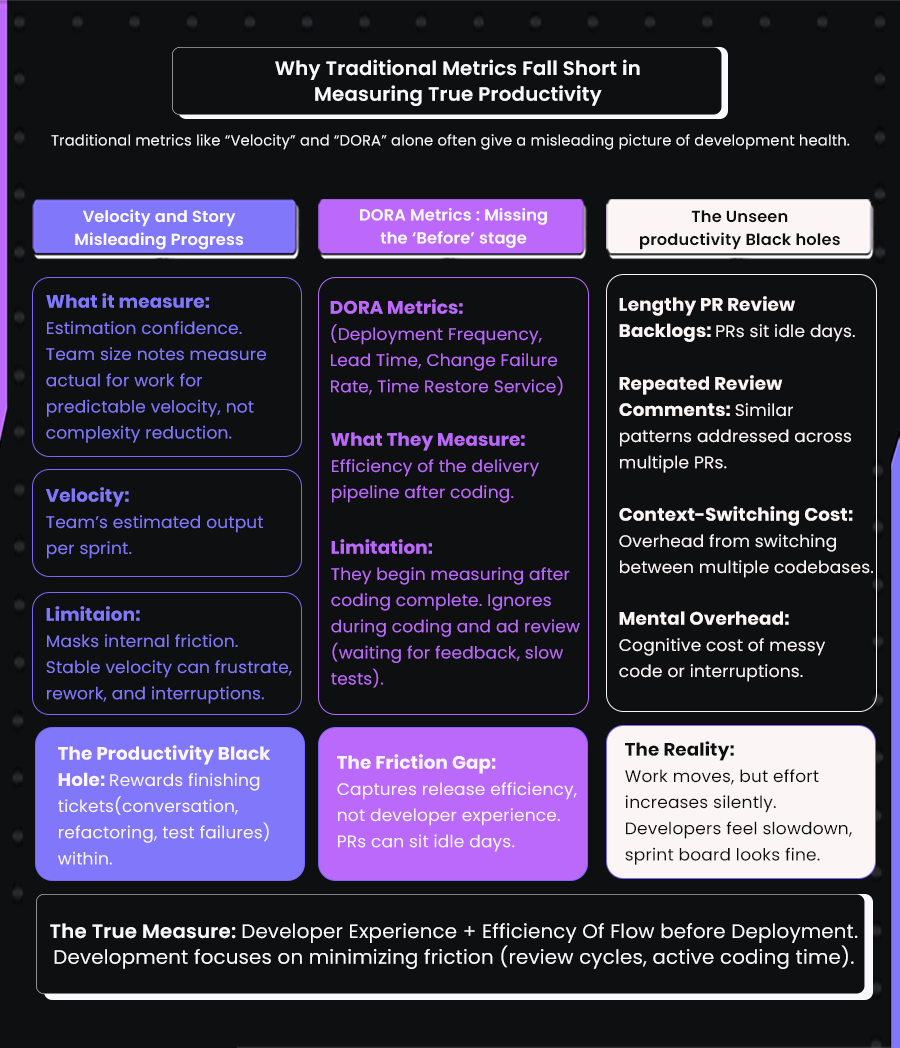
Why Output-Based Metrics Fall Short (Velocity, Story Points, and DORA Alone)
Enterprises often turn to familiar operational metrics when assessing productivity: Jira velocity charts, story points, commit frequency, or DORA indicators like deployment frequency and lead time. These numbers are accessible and comparable across teams, which makes them appear authoritative. Yet in large engineering organizations, they reveal only a narrow slice of reality.
For teams managing dozens of services and distributed review workflows, these metrics rarely reflect the underlying experience of shipping code. Velocity can increase for months while teams struggle with rising clarification work, inconsistent review standards, and late-cycle fixes that never come up in sprint charts.
DORA highlights outcomes after development is complete, but it does not expose the review bottlenecks, coordination delays, or verification load that shape day-to-day throughput, areas that most directly influence engineering productivity in large, distributed organizations


| Model | How It Works | Limitations at Enterprise Scale | Resulting Productivity Impact |
| Velocity / Story Points | Team-estimated effort and sprint throughput | Cannot detect review delays, rework cycles, or cross-team clarification load | Creates the illusion of predictability while daily execution slows |
| DORA Metrics (Deployment Frequency, Lead Time, Change Failure Rate, Time to Restore) | Pipeline outcomes after development is complete | Begins measurement too late; misses review bottlenecks and context switching across repos | Teams optimize deployments but still struggle with upstream friction |
| Manual Code Review | Human-led review of logic, quality, and standards | Breaks down across 50+ distributed teams; inconsistent quality and reviewer bias | Slow, unpredictable review cycles and uneven enforcement of standards |
| Traditional Static Analysis Tools (SonarQube, etc.) | Pattern detection, style checks, security scanning | High noise, limited contextual reasoning, not aware of organizational standards; requires repo-level configuration | Reviewers drown in non-actionable alerts; governance becomes fragmented |
| Qodo (AI Code Review Platform for Enterprises) | Organization-wide governance, multi-repo intelligence, contextual AI reasoning | None of the above constraints; built for multi-language, multi-repo, multi-team environments | Consistent review quality across 10–1000 repos, reduced noise, faster throughput, and measurable lift in DORA outcomes |
Why Story Points Mislead
Story points remain one of the most widely used planning tools in engineering teams, yet they often create an incomplete view of actual productivity. They describe how work is expected to unfold, not how it truly progresses once development begins.
The gap between estimation and day-to-day execution becomes larger as teams optimise for predictable velocity rather than smoother delivery. AI-assisted development has widened this gap further because estimation does not capture the hidden verification work that AI often introduces. Teams become skilled at sizing work to maintain a predictable velocity, not necessarily at lowering code complexity.
Story Points Reflect Estimation Confidence, Not Actual Progress
Story points help teams compare tasks by relative effort, but the number reflects the clarity of the discussion at planning time rather than the realities of implementation. A team can assign consistent point values and maintain stable velocity even when the engineering effort fluctuates significantly across sprints.
Once developers rely on AI-generated suggestions, the estimation covers only the intended logic, not the time spent reviewing, correcting, or validating AI-assisted changes. As a result, velocity signals predictability without representing the true complexity of the work.
Completion of a Ticket Does Not Capture the Work Within It
A ticket is usually complete when the central requirement works, which creates a narrow definition of “done.” Important tasks such as clarifying behaviour, refining validation rules, aligning naming conventions, updating tests, or handling missed edge cases often continue in follow-up adjustments that are not reflected in story points.
The pattern became clear on one of my teams when a feature such as plan-based usage limits was marked complete once the main endpoint responded correctly. The supporting logic, error handling, and test updates continued over the next several days. Story points acknowledged the milestone but ignored the sustained effort around it.
What DORA Metrics Measure and Their Limits
DORA metrics are an important part of how enterprises evaluate the reliability and efficiency of their delivery pipelines. I rely on them in my own teams because they provide a consistent, automated view of how changes move from merge to production.
At the same time, I have seen how these metrics overlook the practical slowdowns that shape a developer’s day. The measurement window starts after coding ends, which leaves out the review delays, clarification cycles, and test bottlenecks that influence productivity long before a deployment begins.
DORA Metrics Track Pipeline Efficiency After Coding Ends
DORA metrics, deployment frequency, lead time for changes, change failure rate, and time to restore service, came out of DevOps Research and Assessment. They are captured through automated delivery systems that record each event from the moment a commit is merged to the point it reaches production. In one of my infrastructure teams running GitHub Actions and ArgoCD, deployment frequency and lead time were calculated by comparing the timestamp of a merged pull request with the rollout event recorded in Argo. This helped us identify when deployment automation slowed the flow of changes.
Automation Identifies Release Delays, Not Development Friction
Automation made it easy for us to diagnose pipeline issues. When lead time spiked, the cause often came from build queues, image-creation delays, or environment preparation tasks. These insights were useful because they showed exactly where release operations needed improvement. But they described only the behaviour of the system after development was complete.
DORA Metrics Do Not Capture Where Work Actually Slows Down
The limitation became obvious when I looked more closely at our code review queues. Lead time looked healthy, yet many pull requests sat idle for long stretches before anyone reviewed them. Those pauses were invisible to DORA because the clock had not started.
Developers experienced delays, uncertainty, and context switching, but the metric showed strong performance. It measured our release efficiency but not the collaboration gaps affecting daily momentum. The gap between what the metric showed and what the team felt was substantial, and DORA offered no signal to detect or address it.
Productivity Black Holes
Every team encounters productivity gaps that never appear in dashboards or planning reports. These gaps are not failures in output but quiet losses in momentum that accumulate throughout the week. I began noticing them when the numbers looked stable but developers reported slower progress and rising cognitive load. The metrics captured outcomes, but they did not uncover the forces that shaped them.
Review Backlogs Create Invisible Delays
Lengthy pull request queues can stall progress even when tasks appear to move forward. A developer may complete a change in a single focused session, yet the work sits idle for hours or days awaiting review. During that time, the mental model fades, and revisiting the change requires a full reset. Metrics such as velocity or deployment frequency never show this pause, but the impact on daily flow is significant.
Repeated Review Comments Add Hidden Rework
I also saw patterns where the same review comments appeared across multiple pull requests. These repetitions created unnecessary loops that consumed attention without improving the system’s structure. The effort was real, but none of it registered in story points or DORA indicators. Each round introduced small delays, and the accumulation of these cycles slowed enterprises far more than any single issue.
Context Switching Across Codebases Increases Cognitive Load
Moving between several repositories in the same day introduces another silent cost. Shifting mental context repeatedly reduces focus and lowers the quality of decision-making. The work continues, and tasks are updated, yet the underlying effort becomes heavier. The sprint board shows steady movement, but developers feel the drag immediately.
The Key Signals I Track to Understand Actual Developer Flow
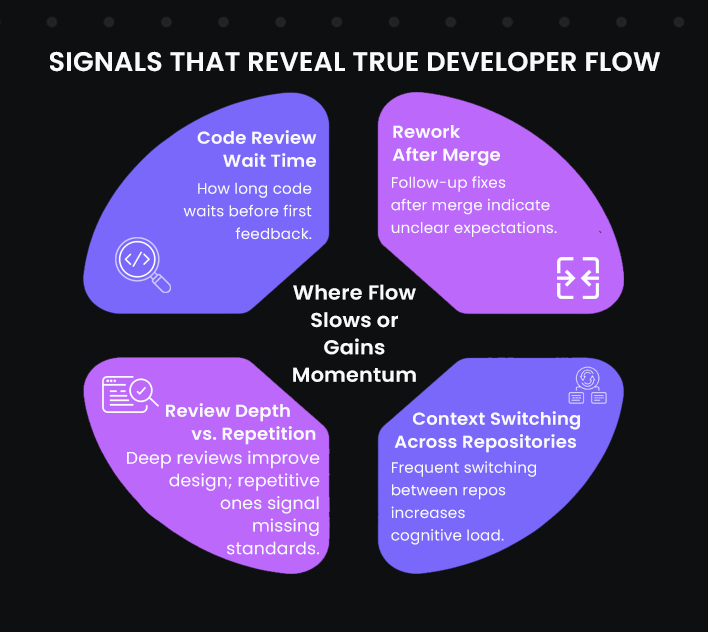
To measure productivity in a fair and useful way, I stopped focusing on how fast the team worked and started looking at where the work slowed down. I began tracking signals that showed friction in the workflow instead of just output. These signals are reviewed at the team level to understand the environment, not to compare or rank individual developers..
Code Review Wait Time
The time between opening a pull request and receiving the first meaningful review is one of the clearest indicators of flow. When that window grows, the developer who opened the PR loses context. They move on to another task, increasing cognitive switching, and the cost of returning to the original change becomes higher.
I first noticed this problem when a small front-end adjustment (which should have taken under an hour) sat in the review queue for nearly a day. By the time someone reviewed it, the developer who made the change was already deep into another ticket. The switch back disrupted momentum and slowed both tasks. The work itself was fine. The delay was the problem.
Once I started tracking this as a trend rather than a one-off incident, patterns appeared: Mondays and late afternoons were reviewed as bottleneck hotspots. That insight helped us schedule review-focused windows during the day and adopt a simple rotation system so no pull request lingered without acknowledgment.
Rework After Merge
Rework is any follow-up commit needed to correct or adjust code after a pull request has already been merged. Some of this is natural. But when we began seeing the same service accumulate two or three corrective commits after nearly every release, it pointed to a deeper issue. The recurring failures weren’t coming from complex logic, they were almost always missed edge cases in authorization rules and date-bound conditions.
Let’s understand this with a specific example: a billing service I worked at generated invoices based on subscription renewal dates. In several merges, developers tested the “happy path” but not transitions at month-end or timezone boundaries.
When those edge cases broke in production, reviewers initially responded with “we need to be more careful” or “double-check tests next time.” In reality, the problem wasn’t effort. Each engineer decided for themselves what “enough test coverage” meant.
We fixed this not by tightening review comments but by making expectations explicit. I wrote a one-page guide titled What a Complete Change Includes. It wasn’t process-heavy; it simply listed the specific failure modes we had historically missed and required every change to address them directly in tests or reasoning notes.
After that, the volume of follow-up commits dropped dramatically. Pull requests took slightly longer to finalize, but we stopped revisiting the same work after the merge.
Context Switching Across Repositories or Services
Productivity erodes every time a developer has to switch to a different codebase, microservice, or domain in the middle of a task. Even a simple internal tool update can pull someone out of flow. The cost isn’t measured in minutes; it shows up as reduced clarity and increased mental overhead.
On one project, a “customer upgrade” flow required coordinated updates across the API gateway, the billing service, the product catalog service, and the customer portal. Each of these services implemented a small part of the eligibility logic, and because that logic was distributed rather than centralized, the developer had to repeatedly stop and reconstruct how the rule worked end-to-end before making any change.
When we mapped the workflow, it became clear that the key challenge was architectural inconsistency rather than developer speed. By extracting the eligibility rule into a shared domain policy layer and exposing it through a versioned interface, we reduced the amount of context a developer needed to hold in their head at once. The improvement showed up not as faster coding, but as smoother, more predictable progress with far less cognitive overhead.
Review Depth Versus Review Repetition
The reviews that move a codebase forward are the ones that question design choices, clarify domain intent, and shallow long-term maintainability risks. They focus on whether a change fits the architecture, whether a boundary is being respected, and whether the behavior aligns with how the system is meant to evolve.
The reviews that drag teams down are the ones spent re-stating the same structural concerns across multiple pull requests, where the reviewer is not analyzing the idea; they are re-enforcing patterns that were never clearly defined in the first place.
We ran into this when multiple teams working on the same service kept re-implementing authorization and validation logic in different places. Reviewers often noted that certain checks should live in the domain layer, not the transport layer, and that some data transformations already existed in shared utilities but were being rewritten locally. These weren’t small code review comments; they showed that architectural boundaries and shared patterns hadn’t been clearly defined for the team to follow consistently.
Improvements That Actually Shifted Productivity
After identifying where the workflow slowed down, the focus shifted to removing friction without adding extra processes. The aim was to improve focus, reduce interruptions, and make progress more consistent. Let’s discuss what improvements are actually helpful in boosting developer productivity:
Reduce Context Switching with Clear Ownership
Context switching became one of the strongest sources of friction on my teams when developers worked across several services in the same week. Each shift required rebuilding a different mental model, which slowed progress and increased the number of follow-up adjustments.
The most effective way I reduced this was by creating clear ownership boundaries. When a small group is responsible for the end-to-end quality of a specific area, the cognitive load drops and the workflow becomes more predictable.
Define Owners Directly in CODEOWNERS
I assign explicit owners in a CODEOWNERS file or enforce ownership through repository settings. Every change requires review from the responsible owners. This keeps reviews focused, distributes responsibility consistently, and prevents work from drifting across teams without clear accountability.
Align On-Call and Backlog With Ownership
I map on-call responsibilities and backlog queues to the same ownership boundaries. The team responsible for a service owns its incidents, operational tasks, and planned improvements. This alignment reduces coordination overhead and gives each group a full view of its domain’s stability and technical depth.
Create Review and Defect SLAs for Each Owned Area
I define service-level expectations (SLAs) for both review response times and defect turnaround within each owned area to keep work moving at a predictable pace. These SLAs specify how quickly owners acknowledge a pull request, when the first round of feedback should be delivered, and the expected window for addressing defects that fall within their domain.
Clear timelines avoid reviews from lingering in queues, reduce the idle gaps between iterations, and give developers a reliable sense of when they can resume work on a change. This consistency maintains momentum across the team and supports a healthier, more predictable development rhythm.
Publish “What We Own” Documentation
Each ownership group maintains a short document outlining what they own: APIs, dependencies, operational runbooks, data flows, and key architectural decisions. I found this reduces ambiguity and supports faster onboarding because new contributors know exactly which team to contact for any given change.
Limit Concurrent Project Assignments
I limit how many projects any developer engages with at the same time. Narrowing focus improves decision quality and reduces the number of mental resets required throughout the week. The combination of scoped assignments and clear ownership improved the pace and clarity of execution significantly.
Lowering Down PR Size to Avoid Review Fatigue
In one payments platform team I led, we eventually reached a point where feature work routinely created pull requests touching twenty or more files at a time. This was not because the features themselves were inherently large, but because multiple layers of the system, data model, permissions, migrations, business rules, and API presentation were being delivered in a single merge.
Reviewers hesitated to even open these PRs because understanding them required reloading the architecture and the interaction patterns between services. Review cycles stretched across several days, which forced developers to move on to other tasks while waiting, and then later return to the original work after the context had faded. The slowdown was not caused by complexity in the code; it was caused by the size of the change and the mental overhead needed to evaluate it.
We made a deliberate shift toward structuring work as a series of incremental changes that aligned with how the system was layered. Instead of pushing a complete feature in one PR, we introduced the supporting structure first and filled in the behavior gradually. A typical sequence looked like this:
- Introduce the data model and migrations as a single PR. This allowed the schema to be discussed independently of business logic.
- Add read and write operations behind a feature flag. The behavior existed but could be toggled off until the rest of the workflow was ready.
- Implement the business rule in a narrowly scoped PR. This kept the domain logic change clear and reviewable.
- Finally, wire the feature into the user-facing workflow and enable the flag.
To make this sustainable, we relied on practices that helped break work down without losing cohesion:
- Feature flags allowed us to merge incomplete work safely, without exposing partially implemented functionality.
- Separating refactoring from feature code ensured reviewers were not forced to evaluate structural changes and new logic at the same time.
- Walking skeletons gave us a minimal but functional vertical slice early, creating clarity about how the final path would connect.
- Draft PRs made it possible to get architectural feedback early, before fine-grained details needed to be finalized.
- Stacked PRs ensured that dependent changes were reviewable in a sequence, not merged as one monolithic block.
Introducing a Daily Review “First-Responder” Rotation
One of the most persistent sources of delivery friction in a backend infrastructure team I worked with was not the complexity of the code itself, but the amount of time pull requests spent waiting in the queue before anyone even acknowledged them. Reviews were something people did only when they had mental bandwidth left over from their primary work, which meant they typically happened at the end of the day, or sometimes days later. By the time the review began, the original developer had already shifted into a different problem space, and the context had to be reconstructed from scratch.
To solve this, we introduce a simple rotation. Each day, one engineer acts as the “first responder” for new pull requests. Their role is not to perform the full review or approve merges. They do not need to evaluate architecture or make final decisions. Their responsibility is to ensure every new pull request is acknowledged quickly and routed correctly. Specifically, the first responder:
- Confirms that the pull request has been seen
- Scans the size and complexity to understand the scope
- Assigns or requests the appropriate reviewers based on ownership and expertise
- Identifies obvious blockers such as missing documentation or failing tests
After the first responder routes the pull request, the code owner performs the full review. The code owner ensures the change aligns with architecture standards, verifies that nothing risky or incorrect is introduced, and provides the final approval.
This small change prevents pull requests from sitting idle. Developers receive feedback sooner, context switching decreases, and the overall flow of delivery improves without adding heavy process overhead.
In enterprises responsible for backend services or infrastructure platforms, the deepest flow interruptions came from PRs sitting idle while everyone was heads-down in their own work. Reviews happened only when someone had spare cognitive space, which meant “when I finish what I’m doing”, a moment that rarely arrives in complex systems work.
The first-responder rotation focused on pull requests because that is where most productivity loss surfaced in this team’s workflow.
- It did not replace other metrics like build duration, test stability, or deployment frequency, which were already being monitored separately.
- The review stage was chosen deliberately since it represented the longest idle time in the delivery cycle, and improving it had a direct, visible effect on overall throughput.
In other words, the first responder handled review triage, not review judgment. This difference mattered, especially when a more junior engineer was on rotation. They did not need to evaluate the correctness of a complex change. They only needed to ensure the review process started in the right direction. The deeper architectural or design feedback still came from the relevant domain-owning reviewers, just without the initial delay.
Why Surfacing Review Issues Earlier *(Shift-Left in Code Review) Helps in Productivity?
Even after we reduced PR size, clarified review expectations, and improved triage, another pattern kept slowing us down: reviewers spent a large portion of their time catching repeatable issues that could have surfaced much earlier. These were not complex architectural discussions. They were things like missing input validation, inconsistent error handling, functions taking on too much responsibility, or test gaps around edge cases.
Refer to this loop below:
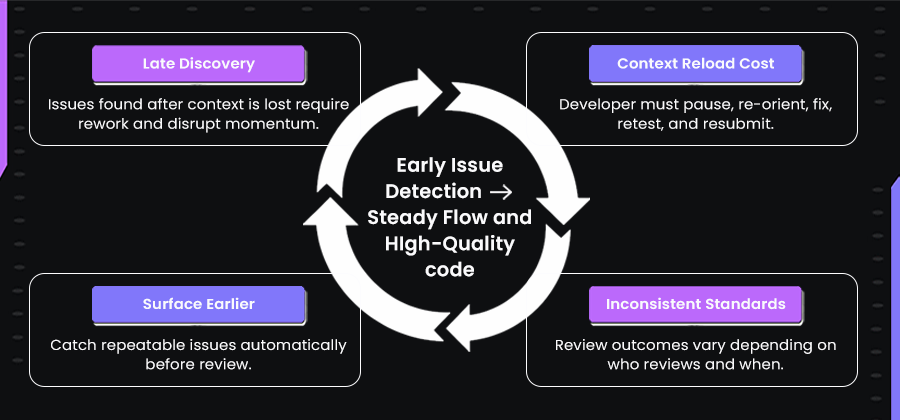
The pattern we kept encountering is reflected in the loop above. When repeatable issues are only caught during review, the developer has usually already moved on to another task. They must pause, reload context, adjust the change, re-run tests, and resubmit. This context reload is where the real productivity loss occurs. These issues are not deep architectural decisions. They are missing input checks, inconsistent naming, duplicated logic, or incomplete tests.
When a reviewer flags them after the developer has already shifted focus, the developer must return to the work, reload context, apply the fix, re-run the tests, and wait for review again. The slowdown is not in writing code. It is being forced to revisit code after the mental thread has already dropped.
There is also a deeper issue. Different reviewers emphasize different quality standards. One may focus on naming clarity. Another may pay close attention to failure paths. Another may prioritize test completeness. These differences are not disagreements. They reflect the reviewer’s past experience and the incidents they have seen before.
Since these expectations are rarely written down, the team relies on individual memory and attention. Review quality becomes inconsistent and unpredictable. Some weeks, discussions go deep. Other weeks, reviews are rushed simply because the reviewer is overloaded.
How do AI Code Review Platforms Help?
In large engineering organizations, review quality depends on how consistently teams catch risks before a pull request enters the queue. When a system can detect complexity issues, missing tests, unsafe assumptions, or duplicated logic early, the entire review cycle changes shape. Reviewers no longer repeat the same pattern-level feedback across dozens of teams. Their attention shifts to architectural reasoning and clarity—the areas that influence reliability across hundreds of services.
Platforms such as Qodo strengthen this shift by analyzing changes within the context of the entire codebase, not just the diff in front of them. This matters when teams operate polyglot systems spread across GitHub, GitLab, and Azure DevOps.
A change that appears harmless in one repository may replicate a known failure pattern discovered in another. For example, a retry loop added to a payments workflow may look correct locally but could mirror logic that once caused duplicate transactions because idempotency safeguards were missing elsewhere. With full multi-repo insight, the platform can bring up that risk instantly.
The same applies to duplication across services. A new API path may reimplement behaviour already solved in a shared library, but without enterprise-wide context, the reviewer might miss the overlap. Qodo raises these signals early so code remains consistent and maintainable across 50 or more distributed teams.
Enterprise Comparison: Manual Review vs Static Tools vs Qodo
| Capability | Manual Review | Traditional Static Tools | Qodo (AI Code Review Platform) |
| Scale Support | Breaks down across 50+ teams; inconsistent guidance | Handles volume but lacks organizational context | Indexes 10-1000 repos; consistent quality across distributed teams |
| Governance | Reviewer-dependent; high variance | Rule-based but noisy and hard to tune at org scale | Centralized governance; org-wide policies without per-repo setup |
| Deployment Options | None | Often heavyweight to run on-prem | Cloud, hybrid, or on-prem deployments; BYOM supported |
| Compliance + Auditability | Manual sign-offs; limited traceability | Basic checks but not aligned to internal standards | Full audit trails, reasoning transparency, and policy enforcement suitable for regulated environments |
| Context Awareness | Limited to the reviewer’s memory | Pattern-level only; no cross-repo insight | Multi-repo, multi-language understanding that detects repeated risks and system-level inconsistencies |
Making Developer Flow Visible Through Code Review Intelligence (Qodo’s Role)
Most delivery delays don’t come from coding but from slow review cycles. When feedback is delayed, developers lose context and have to rebuild their reasoning before making changes. Each idle pull request adds this cognitive reset, slowing progress more than any single bug or test ever could.
Context is not lost because developers forget how to code. It is lost because software work is deeply state-dependent: the mental map of interacting functions, domain rules, and invariants only exists sharply when it is being actively worked on.
Once the developer shifts context, reopening a pull request is not just “picking up where they left off”; it is reacquiring the entire shape of the problem. This is the invisible cost hidden inside review delays, and it compounds when review feedback is repetitive, inconsistent, or spread across multiple back-and-forth comment cycles.
Qodo is built for this part of the review and collaboration workflow. Qodo is the AI Code review platform for the enterprise SDLC. It makes developer flow visible and measurable by applying deep context intelligence to every pull request. Instead of treating a PR as a small diff, Qodo analyzes the change in the context of the entire codebase, previous incidents, ownership boundaries, architectural patterns, and prior review history.
Using:
- Pull Request Review for AI-powered quality, compliance, and coverage checks
- Local Code Review in the IDE and CLI to detect issues early
- Agentic Quality Workflows that automate multi-step review and standards enforcement
- The Qodo Context Engine that transforms the codebase into a searchable, context-aware model
Qodo surfaces insights the moment a change is made. It recognizes repeated logic, emerging complexity, and areas that historically create defects. Reviewers no longer spend time scanning for the same risks over and over. Developers maintain momentum because context is still fresh.
This shifts when issues are caught. It prevents unnecessary rework. And it keeps delivery velocity high without compromising code quality or maintainability.
Qodo does not replace existing IDE assistants. It complements them by serving as the reasoning and enforcement layer of the SDLC, ensuring constant quality across repos, teams, and workflows.
Qodo is not a performance scoring system and does not evaluate individual developers. It provides shared visibility into how a change interacts with the existing codebase so that review quality is more consistent and less dependent on who happens to review the pull request. The result is a steadier flow, fewer interruptions, and a code review process that scales with the team rather than slowing it down.
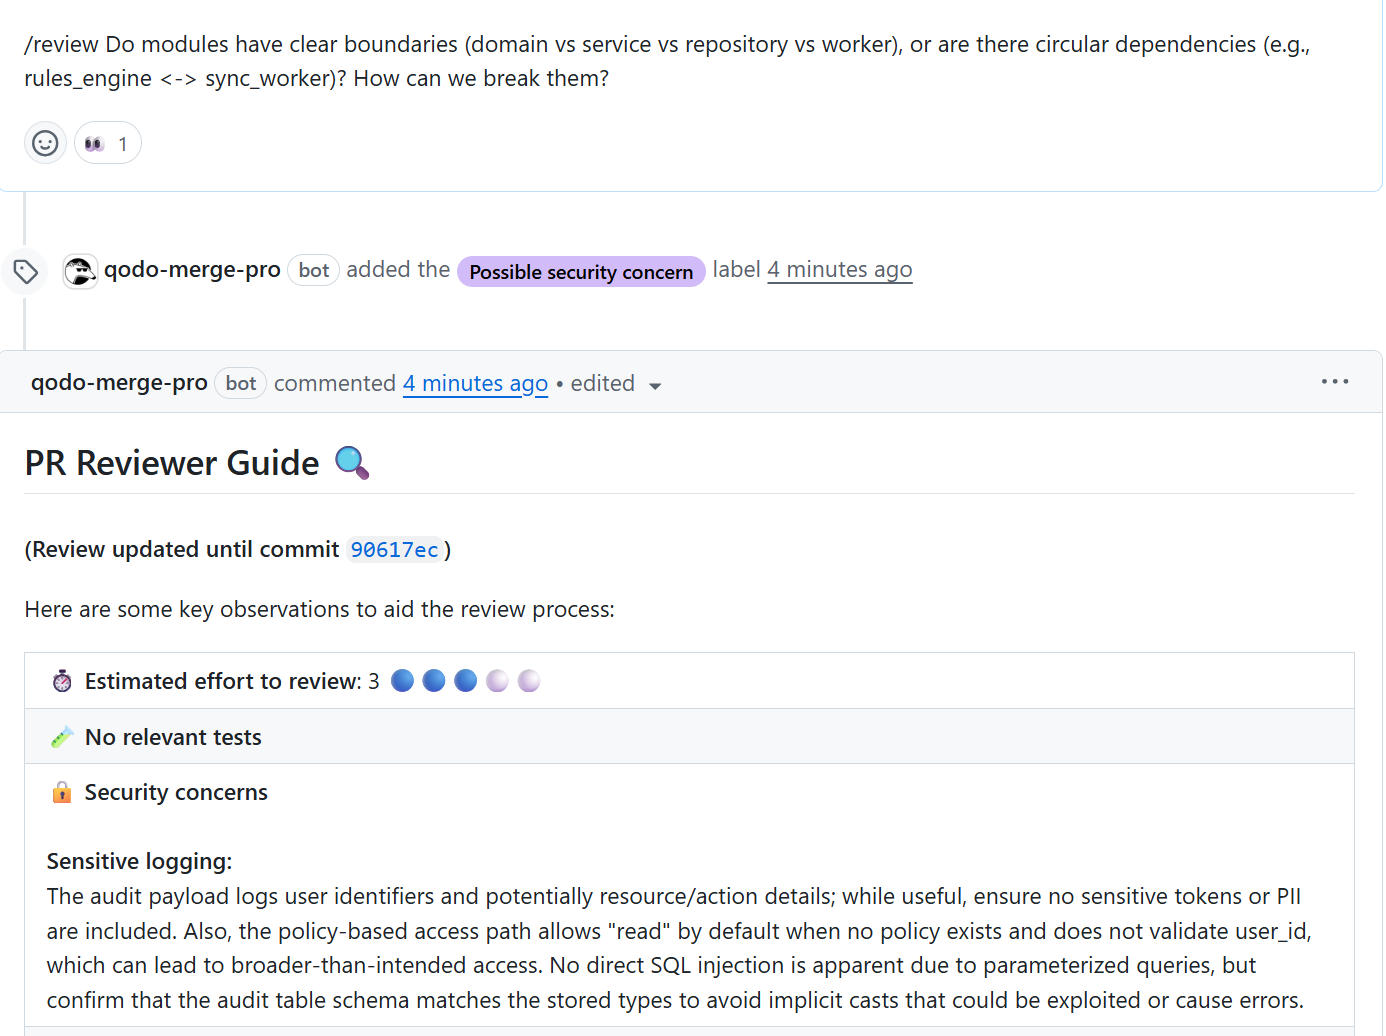
First-Hand Example: Reviewing the Feature Work With Qodo
I introduced new policy management and audit logging features that increased complexity in the service:
- The audit service mixed async and sync database access.
- Permission evaluation logic was duplicated across multiple modules instead of using the shared policy layer.
- Request model naming was inconsistent across endpoints.
These changes worked correctly, but they added cognitive load and made the code harder to reason about over time.
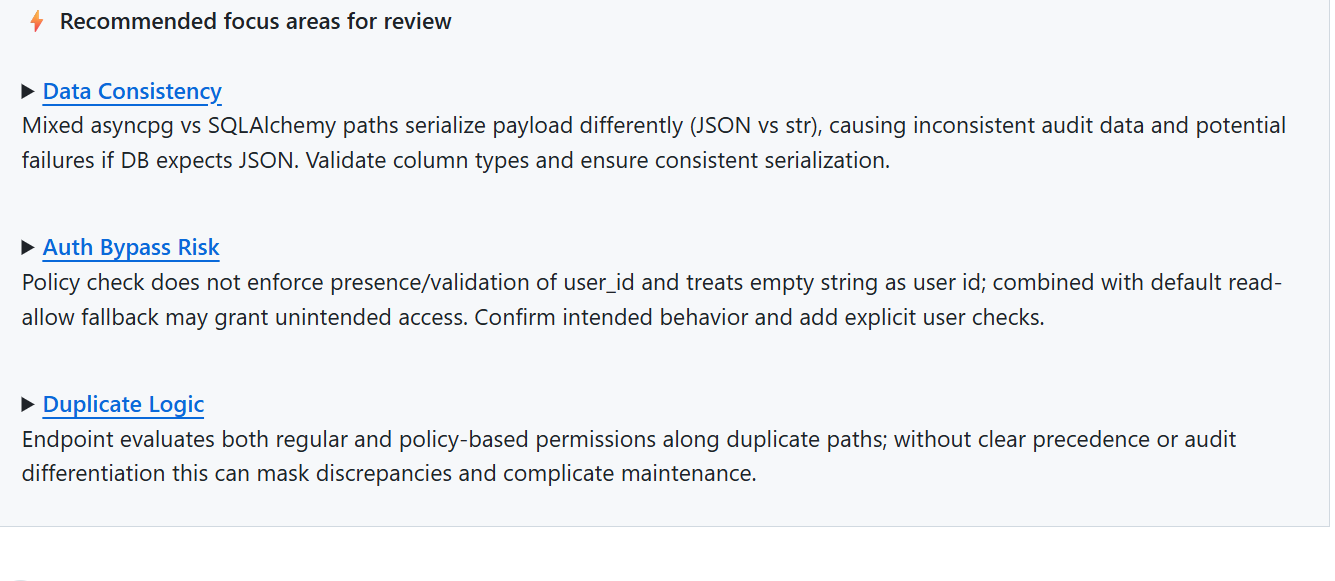
When I opened the pull request, Qodo generated a structured review guide that highlighted several points that would have been time-consuming to detect manually. It flagged that the asynchronous audit writer passed raw dict payloads directly into an insert statement, relying on implicit casting to a TEXT column.
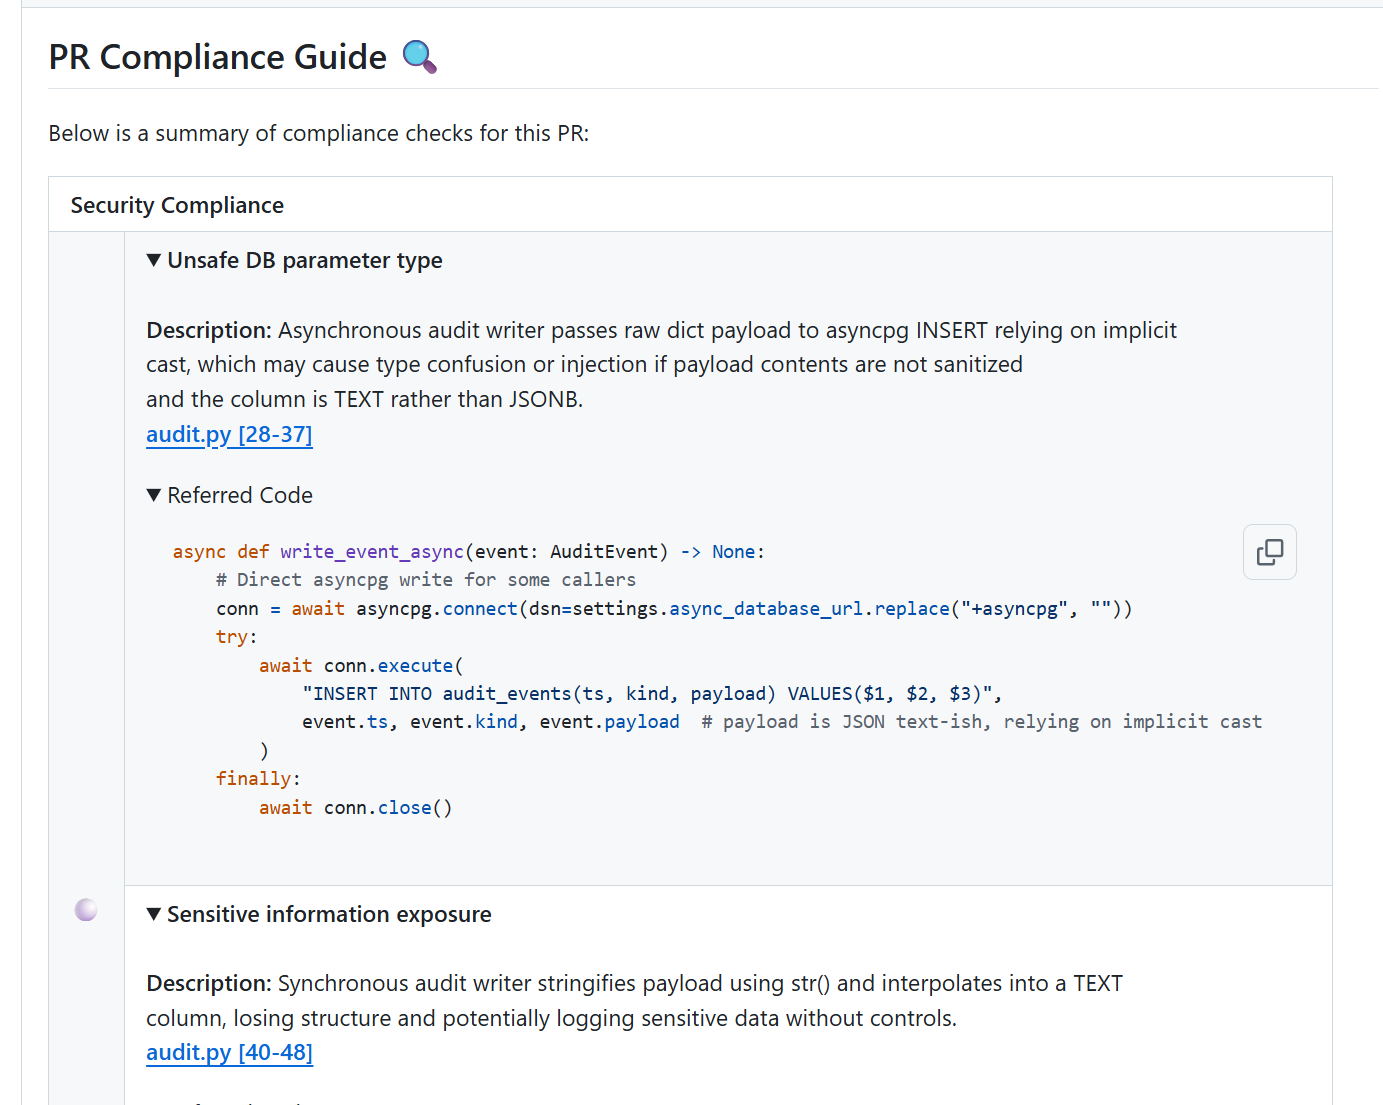
This surfaced both a type safety concern and a potential injection or logging integrity issue. Qodo also pointed out that the synchronous audit path used a different serialization approach, which could lead to inconsistent audit records and make troubleshooting more difficult later.
Qodo then identified the naming inconsistencies in the UpsertPolicy model and related request handlers. Variables such as resourceId, resource, and resource_id were being used interchangeably. Here’s a snapshot:
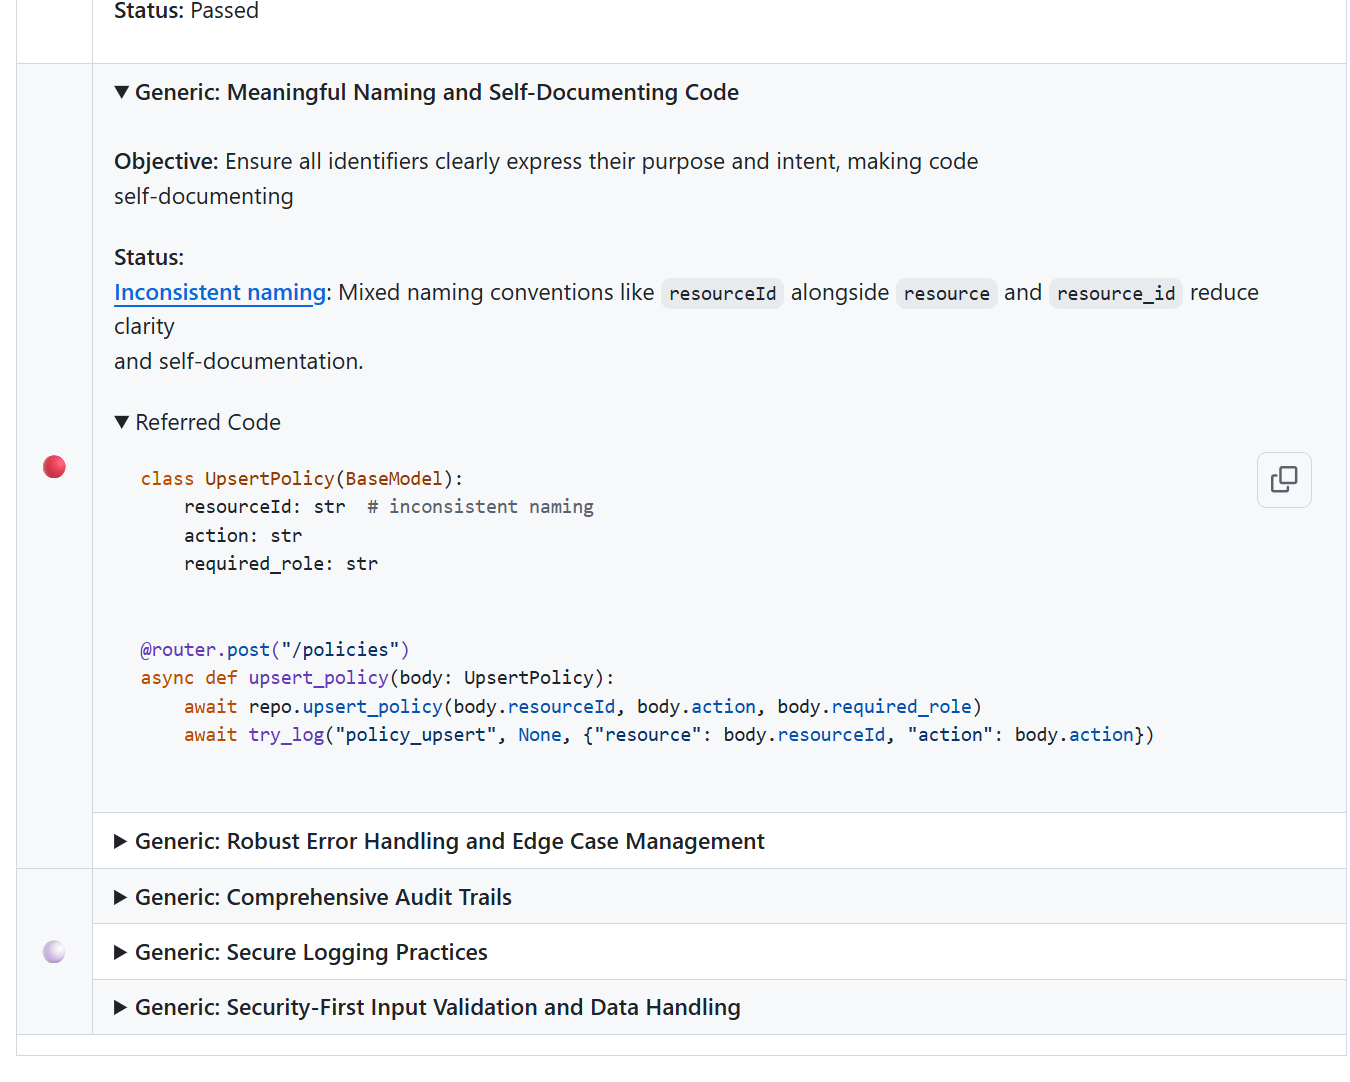
This is the kind of issue teams often do not correct because it does not cause an immediate failure, yet it gradually increases the effort required for future work. Calling it out early made it straightforward to align naming across the API, repository, and domain layers.
The review also surfaced duplicated permission evaluation logic across the policy_permissions and domain rules modules.
Without intervention, this duplication would make future behavioral changes more error-prone. Qodo recommended centralizing the evaluation path and clarifying how administrative overrides should be enforced. That guidance helped reduce both the size of the code changes and the number of branches in the logic.
Finally, Qodo highlighted that some pull request paths lacked corresponding tests. Instead of simply stating that coverage was missing, it pointed to the specific execution paths that would be the most fragile if left untested, such as the fallback behavior when no policy is found and the admin override check. That made test planning more direct and reduced guesswork about what mattered.
This review experience showed that the impact was not only about catching bugs. It reduced the back-and-forth review cycle, prevented rework after merge, and preserved clarity in areas of the code that were likely to evolve. The result was a cleaner merge and a codebase that will be easier to maintain and extend in future iterations.
These review findings led to a series of solid improvements that reduced complexity and made the new features easier to maintain. The table below summarizes the key changes and their impact on the codebase.
| Area Reviewed | Before | After |
| Audit Logging Implementation | Two separate logging paths (async and sync) serialized payloads differently. The async path relied on implicit TEXT casting, increasing the risk of type confusion and inconsistent records. | Both paths now serialize payloads consistently. The database column type is explicitly validated, and implicit casting is removed, improving reliability and clarity. |
| Naming and Self-Documentation | Models and handlers used mixed naming conventions (resourceId, resource, resource_id), requiring extra effort to understand data flow. | Naming is standardized across request models, domain objects, and repositories, lowering down cognitive overhead and making intent clear. |
| Permission Evaluation Logic | Policy-based and default permission checks were implemented twice, creating duplicated logic that would be difficult to maintain. | The logic was consolidated into a single evaluation function, removing redundancy and simplifying future modifications to access rules. |
| Admin Override Behavior | Override rules depended on loosely documented fallbacks and missing null checks, which increased ambiguity about intended access behavior. | Override evaluation is now explicit, with clear failure and allowed paths, avoiding unexpected access outcomes. |
| Audit Error Handling | The async audit worker swallowed exceptions silently, making failures invisible and undermining debugging. | Logging and exception reporting were aligned across both audit paths so failures are visible and traceable. |
| Test Coverage Expectations | Key permissions and fallback paths had no direct tests, making the system sensitive to regressions when rules evolve. | Targeted tests were added where Qodo identified the highest fragility, strengthening correctness where behavior matters most. |
Conclusion
Developer productivity matters because it shapes both the pace and the quality of the work. When developers can stay in flow, understand the problem clearly, and move changes through review without long delays or constant context switching, progress feels steady and predictable. When that flow is interrupted, the team may still appear productive in dashboards, but the work feels heavier, slower, and harder to sustain. Productivity is not about increasing output. It is about lowering the effort required to make progress.
AI code review tools help at the point where friction most often appears: the review stage. By surfacing repeated patterns, complexity risks, missing context, or gaps in test coverage while the developer is still working, these tools reduce the rework loops that break momentum. Reviewers can focus on reasoning and design instead of scanning for issues they have flagged many times before. The result is not faster coding, but smoother movement through the work. That is the version of productivity that teams can feel, maintain, and consistently improve.
FAQs
What makes developer productivity difficult to measure?
Software work is highly contextual. Two tasks that look similar on the sprint board may require very different levels of reasoning, coordination, or rework. Traditional output metrics capture what is delivered, but not the effort or interruptions involved in delivering it.
Why aren’t velocity and story points enough?
Velocity and story points reflect estimation patterns, not the complexity of the work itself. Teams often learn to size tasks consistently, which keeps charts stable even when the workflow is fragmented or slow. These metrics describe predictability, not actual flow.
How do code review delays impact productivity?
When a pull request waits too long for review, the developer who opened it loses context. They switch to another task, and then must re-orient their thinking when the review comes in. This context reset increases cognitive load and slows both tasks.
Where do AI code review tools help the most?
AI tools reduce repeated review effort by catching patterns, complexity signals, or missing tests early. This allows reviewers to focus on reasoning and trade-offs rather than scanning for the same issues across multiple pull requests.
Does improving productivity mean developers work faster?
No. The goal is to make progress that requires less mental effort. When reviews are timely, expectations are shared, and context switching is reduced, progress happens more steadily without pushing anyone to work harder.