Software Testing Metrics That Matter: From Defect Density to Compliance Reporting in Enterprises
TL;DR
- Shallow metrics don’t scale since counting test cases or bugs doesn’t help enterprises predict delivery, prove compliance, or control costs. Metrics must map to risk, requirements, and business outcomes. That’s why many teams combine code quality insights with code complexity analysis to get a more accurate view of release readiness.
- Metrics fall into three layers: process (pipeline efficiency), product (software reliability), and project (delivery health and cost of quality). All three are needed for a complete view.
- At the engineering manager level, metrics are levers, not numbers. They drive predictability of release trains, ROI in quality engineering, and audit readiness. Dashboards that show numbers without meaning quickly lose credibility.
- Enterprise-critical metrics include: Defect Removal Efficiency (DRE), test cycle time, automation coverage (risk-weighted), defect density, escaped defects, MTTD/MTTR, and cost of quality.
- Best practices: align metrics with business goals, balance coverage vs. velocity, eliminate vanity numbers, build real-time dashboards, and evolve metrics as systems shift (microservices, AI).
- Qodo transforms metrics into enterprise value. It generates context-aware tests, prevents defects at source, enforces traceability, and produces compliance-ready reports, turning QA data into a foundation of trust for leadership, auditors, and customers.
In enterprise organizations, software testing metrics aren’t just numbers on a QA dashboard. They determine whether a release can go live on time, whether compliance audits can be passed, and whether delivery risks are properly managed. At this scale, raw activity counts such as “10,000 tests executed” or “200 bugs closed” offer little real insight. They don’t show whether the right defects are being caught, whether coverage aligns with critical business workflows, or whether compliance gaps remain.
The cost of ignoring this is real. Forbes recently cited research showing 40% of organizations lose more than $1M every year due to poor software quality. That loss doesn’t come from just fixing bugs. It’s the downtime, SLA penalties, regulatory hits, and delayed product rollouts that eat into the business. I’ve seen releases slip weeks because defects were caught late, and the rework cascaded across multiple teams. That’s what shallow metrics fail to surface early.
The real questions leadership needs answered are:
- Can this release go live without taking production down?
- Do we have compliance-ready evidence of testing and defect tracking?
- Where are we leaking quality costs, in requirements, in development, or post-release?
Without metrics tied to these questions, organizations are flying blind. And in environments with distributed systems, dozens of microservices, or regulated workloads, blind spots can quickly escalate into outages, compliance findings, or seven-figure overruns. That’s why adopting practices like automated code review is critical to ensuring that metrics move beyond vanity numbers and deliver actionable insights.
Good metrics turn QA from a background activity into a control surface for engineering. They expose risk, validate compliance, and tie testing outcomes back to business impact.
In this blog, we’ll break down which testing metrics actually matter at enterprise scale, from defect density and cycle time to compliance-ready reporting, and how to align them with both engineering execution and business outcomes.
What Are Software Testing Metrics? (An Enterprise View)
The real measure of testing isn’t how many tests you run or bugs you log, but whether your pipeline catches risks early, provides reliable signals, and proves compliance. They don’t show risk, compliance, or cost. What matters are the metrics that indicate whether your testing pipeline is doing its job, catching risks early, producing reliable signals, and providing coverage where it’s required.
Defining Test Metrics in Modern QA
In practice, these are the metrics that matter:
- Mutation Score (unit/component level). Measures how effective unit tests are at catching faults, not just executing lines. Example: a React form validator should reject a negative price; if mutation flips that logic and tests still pass, your coverage is misleading.
- Contract Verification Rate (integration level). In a microservices setup, a provider builds only if it satisfies all registered consumer contracts. The metric is simple: 100% contract verification before release.
- Regression Flake Rate (end-to-end). Tracks the stability of critical flow tests like login, checkout, or refund. A suite that fails randomly one in ten runs can’t be trusted to block releases.
- Test Cycle Time. Measures how long it takes to get a verdict in the suit. If a blocking regression run takes 12 hours, you can’t release quickly. Keeping this under 30 minutes for CI-critical suites is the norm.
- P95 / P99 Latency (performance). Load tests check that APIs stay within SLA at 3–5× expected traffic. If checkout or payment endpoints exceed thresholds under stress, that’s a hard stop.
- Zero Critical Vulnerabilities (security). Static, dependency, and dynamic scans must pass with no critical issues. Anything else means you’re accepting a production risk.
- Coverage by Requirement (compliance). In regulated workloads, tests must be traceable back to requirements. Some modules also require branch or MC/DC coverage reports as formal audit evidence.
Each of these metrics listed above isn’t just a number; it acts as a release gate. Here’s how:
- A low mutation score means unit tests aren’t effective.
- Incomplete contract verification means that downstream consumers will break.
- A high flake rate means CI results can’t be trusted.
- Missing compliance coverage means the release fails the audit.
That’s the difference between activity tracking and enterprise testing metrics: these metrics decide whether software can move forward. What ties all of this together is that each stage produces a metric that’s more than a number; it’s a gate. If the mutation score is low, or a contract test fails, or a compliance report shows insufficient cov/erage, the release halts.
Why Enterprises Can’t Ignore Metrics Like Cycle Time, Traceability, and DRE
In enterprise delivery, a few metrics directly determine whether releases are reliable, compliant, and cost-effective. The most critical are test cycle time, requirements-to-test traceability, defect removal efficiency (DRE), and escaped defects with their associated costs.
Test Cycle Time
This is the time it takes for a test suite to run and return a clear result. In one large organization, the regression suite stretched from under two hours to more than fourteen as new tests were added without optimization. That delay meant urgent fixes couldn’t be validated until the next day, blocking daily deployments and slowing incident recovery. Tracking cycle time shows exactly when testing has become a bottleneck and forces teams to optimize suites, split workloads, or prioritize only the gates that matter.
Requirements-to-Test Traceability
In regulated industries, every requirement must be tied to an automated test, the result of its execution, and a linked defect record if the test fails. Auditors rely on that chain of evidence, not just on the fact that the system runs correctly. A financial services team once failed a SOX audit despite accurate production outputs, simply because they couldn’t prove which accounting rules had corresponding automated test coverage. Without traceability, compliance fails even if the software appears solid.
Defect Removal Efficiency
DRE reflects how many defects are caught before release compared to those discovered in production. If only seven out of ten defects are found early, the remaining three will show up post-release, where fixes are far more disruptive and expensive. Production bugs require incident response teams, customer communication, and often downtime management. Low DRE is one of the clearest signs that pre-release quality controls aren’t effective enough.
Escaped Defects and Cost of Quality
Escaped defects measure not only the bugs missed in testing but also the downstream cost of fixing them. The expense goes well beyond the code change; it includes SLA penalties, customer reimbursements, and delays across dependent teams. In one payment platform, a missed regression in refund logic caused customers to receive refunds in the wrong currency. Caught in staging, it would have been a quick patch. In production, it triggered a full incident response, reimbursement workflows, and pushed back scheduled releases. The defect was minor; the absence of metrics to catch it early made it costly.
Cycle time shows whether testing slows delivery. Traceability determines audit outcomes. DRE indicates whether defects are being caught soon enough. Escaped defects expose the financial and operational cost of weak gates. These metrics are not side reports; they are the mechanisms that keep enterprise software delivery predictable, compliant, and economically sustainable.
Test Metrics vs. Quality Metrics
Once you acknowledge that metrics are essential, the next step is to determine what you should measure.


In enterprises, test metrics without quality metrics leave you blind to real-world performance. Quality metrics without test metrics mean you’re always reacting instead of preventing. Enterprises can’t afford either imbalance.
The Three Levels of Software Testing Metrics
Enterprises don’t just deal with a few numbers; they deal with floods of raw signals: regression results, coverage reports, defect logs, and incident data. Without structure, it’s noise. To make metrics actionable, you need a framework that organizes them into layers leaders can actually use. That’s where the three levels of software testing metrics come in:
- Process metrics show whether the pipeline is healthy. Examples: regression runs complete in under 30 minutes, the flake rate stays below 1%, and all consumer contracts are verified before release.
- Product metrics measure system reliability. Examples: defect density trending down, zero Sev-1 escapes, and latency staying within SLA during peak load.
- Project metrics track delivery health. Examples: progress against sprint commitments, mean time to detect and resolve critical defects, and the balance of cost between prevention and failure.
These three layers form a feedback loop. Weak process metrics (like unstable regressions) eventually drag down product quality. Ignoring product metrics leads to delivery slips, no matter how fast the pipeline runs. Taken together, they give leaders a structured view of whether engineering is on track, compliant, and cost-efficient. Modern teams are beginning to integrate agentic workflows to orchestrate this feedback loop automatically, ensuring that metrics adapt as systems evolve.
How Leaders Use Software Testing Metrics for Predictability, ROI, and Compliance
Once metrics are grouped into process, product, and project layers, the conversation at the leadership level shifts. Metrics are no longer about test counts or pipeline mechanics; they’re about predictability, risk, ROI, and compliance visibility.
1. Predictability and Risk Mitigation
The biggest risk at enterprise scale is not knowing whether a release train will land cleanly. Metrics are the early-warning system:
- Test cycle time indicates whether the delivery cadence aligns with business expectations. If regression runs creep from 30 minutes to 14 hours, you already know daily releases are at risk.
- The defect detection rate per stage indicates whether bugs are escaping upstream gates. If too many slip past unit and integration, your staging environment becomes unstable.
- Contract verification highlights downstream failures before they hit staging. A 100% pass rate means microservices will integrate; any drop predicts broken consumers.
2. ROI of Quality Engineering
Engineering leaders are expected to justify QA investments. Metrics make this concrete:
- The cost of quality indicates whether spending is shifting toward prevention and away from production failures.
- Example: One payments team raised automation coverage of high-risk flows from 60% to 85%. Their Defect Removal Efficiency (DRE) improved from 0.78 to 0.93, and escaped production defects dropped by 40%. That meant fewer Sev-1 incidents, less downtime, and lower SLA penalties, proof of ROI, not just a slide claim.
3. Compliance and Traceability
In regulated industries, auditors want evidence, not assurances. Metrics provide that:
- Requirements-to-test coverage proves every SOX or PCI control has automated validation.
- Defect traceability links every failed test to a ticket and verified fix.
- Structural coverage reports (branch, decision, or MC/DC) are attached for high-risk modules like payment reconciliation or fraud detection.
In one SOX audit, a financial service failed not because of broken code, but because it couldn’t prove which reconciliation rules had automated tests or whether those tests had been executed. The engineering was fine; the compliance metrics were missing.
The Three Levels of Metrics That Matter

Enterprises deal with dozens of raw signals, test runs, coverage, defects, incidents, and it’s impossible to act on them without structure. The practical way to organize them is in three levels: process, product, and project metrics. Each layer answers a different question, and all three feed into each other.
- Process metrics track the health of the pipeline: regression runs are under 30 minutes, the flake rate is below 1%, and all consumer contracts are verified before release.
- Product metrics reflect system reliability: defect density trending downward, zero Sev-1 escapes, and latency staying within SLA at peak load.
- Project metrics measure delivery health: execution progress against sprint plans, mean time to detect and fix critical defects, and the cost of quality split between prevention and failure.
If process metrics are weak, such as regressions being unstable, product quality inevitably suffers. If product metrics are ignored, project delivery will slip, no matter how fast the pipeline runs. Together, these layers create a closed feedback loop that enables leadership to assess whether engineering is on track, compliant, and economically efficient.
Turning Test Metrics into Predictability, Risk Signals, and ROI
In the last section, we broke metrics down into process, product, and project layers. That structure helps engineering teams stay aligned. But at the CTO level, the conversation shifts: metrics aren’t just about engineering discipline, they’re about predictability, risk management, ROI, and compliance visibility.
Predictability & Risk Mitigation
At enterprise scale, the biggest risk is not knowing whether a release train will land cleanly. Metrics like test cycle time and defect detection rate per stage are the early-warning system. If regression runs are trending longer, or if too many defects are escaping the unit and integration gates, you already know your release is at risk.
For example, in a multi-service payments platform, if contract verification completion drops below 100%, you can predict downstream failures before they show up in staging. That metric doesn’t just flag a broken service; it tells leadership the delivery date is in jeopardy. Predictability comes from being able to surface those risks while there’s still time to act.
ROI of Quality Engineering
Directors of engineering are always asked to justify investment in testing and QA automation. The metric that bridges engineering to finance is the cost of quality. By tracking the balance between prevention, appraisal, and failure costs, you can show whether investments in automation and tooling are actually reducing downstream failures.
For example, one team raised automation coverage of high-risk workflows from 60% to 85%. Their DRE improved from 0.78 to 0.93, and the number of escaped defects in production dropped by 40%. The result was fewer Sev-1 incidents, less downtime, and lower SLA penalties. The ROI was clear and traceable through metrics, not just argued in slides.
Compliance & Traceability
In regulated industries, auditors demand a verifiable chain of evidence. That’s why teams extend requirements-to-test traceability with code review tools, ensuring every change is documented, reviewed, and mapped to compliance standards.
Take SOX controls in a financial service where a requirement like “all payment transactions must reconcile against the general ledger” isn’t satisfied by code reviews alone. It has to map to an automated test in CI that validates reconciliation logic on every build. That test must produce an execution result, and if it fails, the resulting defect must be tracked through to resolution.
The metrics that make this auditable are:
- Requirements-to-test coverage ratio shows which SOX or PCI requirements have automated validation and which don’t.
- Defect traceability: every failed test is linked to a ticket with a verified fix.
- Structural coverage compliance, for high-risk modules (e.g., payment reconciliation, fraud detection), branch or MC/DC coverage reports attached to audit evidence.
In one SOX audit I worked through, the code itself passed functional checks, but the team failed the audit because they couldn’t prove which reconciliation rules had tests and whether those tests had actually been executed. The gap wasn’t in engineering quality, it was in the compliance metrics that tied requirements to test evidence.
Common Pitfalls in Current Practices
Despite the importance, enterprises still fall into traps with metrics.
One is inconsistent tracking, different teams measuring coverage or defect density differently, making roll-ups impossible. Another is vanity metrics, reporting on the number of test cases written, without any correlation to risk coverage. The most dangerous pitfall is producing metrics that are not actionable. A dashboard showing “2,000 tests executed” doesn’t help anyone decide if a release is safe. A dashboard showing “contract verification incomplete for 3 consumers” does.
Enterprises that don’t standardize metrics across teams end up with noise instead of signal, and executives lose trust in the data. Once that trust is gone, metrics become a compliance checkbox instead of an engineering control.
Enterprise Test Metrics That Drive Outcomes
Now that we’ve looked at metrics from an engineering manager’s perspective, the question becomes: which metrics actually matter in day-to-day enterprise delivery? Not vanity numbers, not generic coverage percentages, but the ones that give engineering leaders control over quality, predictability, and compliance.
These fall into three categories: process metrics, product metrics, and project metrics. Each serves a different purpose, but together they form the closed loop that keeps enterprise software delivery accountable.
Process Metrics: Efficiency of the Testing Pipeline
Process metrics measure how effectively the testing system itself operates within CI/CD.
- Defect Removal Efficiency (DRE): Formula:
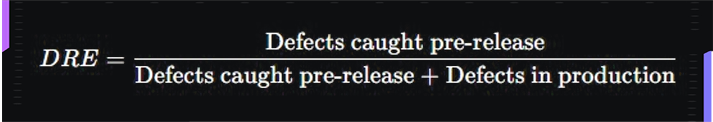
A DRE above 90% is typical for mature orgs. Anything lower signals that too many defects are slipping past testing, driving up production costs.
- Test Case Effectiveness: Formula:
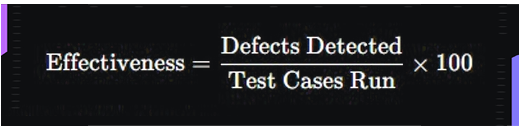
Goes beyond raw execution counts, highlighting whether test cases are written to find real bugs.
- Test Cycle Time: Measures how long it takes for a test suite to run and produce actionable results. If your regression suite takes 12+ hours, you can’t support continuous delivery. Best practice is keeping critical suites under 30 minutes in CI and full regressions under a few hours.
- Defect Fixing Time: Identifies workflow inefficiencies; long fix times cascade into delayed releases
- Automation Coverage: Not just a raw % of tests automated. The relevant metric is risk-weighted automation coverage, i.e., how much of your high-priority, high-risk business workflows are covered by automation. Automating trivial tests adds no value if critical flows like payments or compliance checks aren’t included.
Product Metrics: Reliability of the Software Itself
Product metrics show whether the system is actually stable and correct once it’s built.
- Test Coverage (functional + requirements-based): This is not code coverage percentages alone. Enterprises map requirements to executable tests, ensuring regulatory and contractual obligations are validated. For critical systems, structural coverage (branch, decision, MC/DC) is often required as evidence.
- Defect Density: Typically expressed as defects per thousand lines of code (KLOC) or per module. More meaningful at enterprise scale is defect density per service, normalized by change rate. High density in a service that rarely changes points to architectural or test gap issues. Here’s how we get it calculated:
Formula:

Identifies hotspots, a module with high defect density relative to its size may indicate architectural weakness or testing blind spots.
- Passed/Failed Test Case Ratio: Raw pass/fail ratios aren’t enough on their own, but trends highlight stability across releases.
- Escaped Defects into Production: The raw number of bugs that make it past pre-release testing. Tracked by severity, this shows whether testing gates are holding. A spike in Sev-1 production incidents is the strongest indicator that upstream quality controls are failing.
Project & Business Metrics: Delivery Health and Economics
Project-level metrics connect testing back to delivery timelines and business impact.
- Test Coverage (Requirements-Based): Formula:

Ensures all compliance-critical and revenue-critical workflows are validated. For regulated workloads, requirements for test traceability are mandatory.
- Cost of Testing: Captures total expenditure across prevention, appraisal, and failure. Formula:
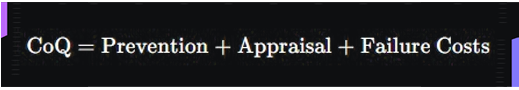
Shows whether investments are shifting detection earlier (cheap) or letting defects escape to production (expensive).
- Mean Time to Detect (MTTD) / Mean Time to Resolve (MTTR): MTTD measures how quickly defects are surfaced after code is introduced. MTTR measures how long it takes to ship a verified fix. Enterprises often target hours, not days, for Sev-1 issues.
When these metrics are measured consistently and tied back to requirements, they stop being “QA data” and become decision levers. They tell engineering leadership not only whether the system is working, but whether delivery is predictable, compliance is provable, and costs are under control.
How Qodo Transforms Software Testing Metrics for Enterprises
Enterprises don’t need to be convinced that metrics matter; the challenge is making them accurate, consistent, and auditable without building a patchwork of tools. In most organizations, coverage gates, scanners, traceability scripts, and compliance reports all exist, but they’re scattered and often produce vanity numbers instead of actionable insights.
Qodo solves this by embedding codebase understanding and automated code review into the delivery pipeline. Every change is validated for coverage, compliance, and standards before it merges. Metrics like DRE, flake rate, and requirements coverage become trustworthy by default because they’re enforced in CI/CD, not stitched together later. Instead of juggling multiple tools and custom scripts, Qodo delivers one workflow that turns metrics into real release controls.
Hands-on: applying Qodo to the payments-service monorepo
Context. We’re working in a Node.js monorepo with four domains (auth, catalog, cart, payments). Each domain has unit, contract, and E2E integration tests. The repository already includes: coverage gates, untested diff detection, flaky test quarantine, requirements traceability, enterprise metrics, and a PDF compliance report.
packages/{auth,catalog,cart,payments}
scripts/{ci,metrics/report,traceability}
requirements.yaml
traceability.csv
.github/workflows/ci.yml
1) Generate targeted tests with Qodo Gen (no test bloat)
Prompt used (payments API):
- POST /initiatePayment {amount, currency, cardNumber}
- POST /refund {transactionId, amount}
- GET /checkStatus {transactionId}
Ask Qodo to generate a compact, context-aware suite that covers success, edge, and error paths, validates no PAN exposure, avoids shallow cases, and links each test to a business/compliance rule. Here’s how that looks in Qodo’s agentic IDE chat:
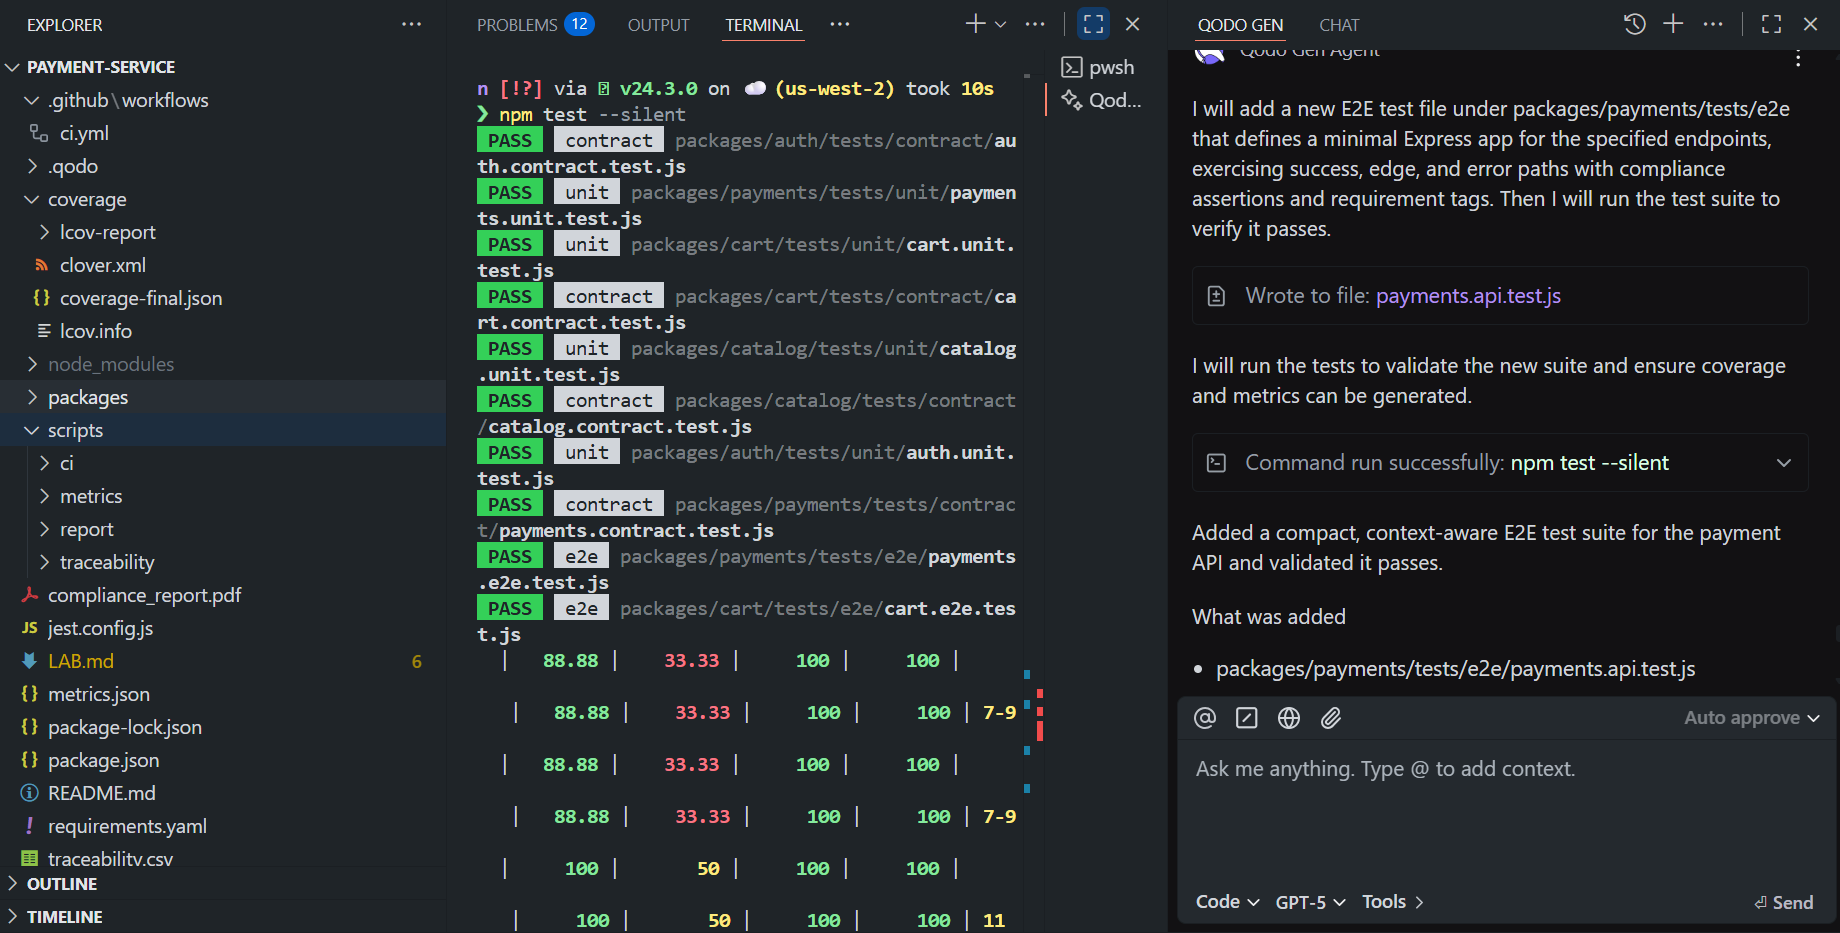
In the above response, Qodo created a single, focused E2E file:
packages/payments/tests/e2e/payments.api.test.js
It exercises real flows against a minimal in-memory Express app, with assertions that matter (e.g., status, amounts, over-refund rejection, 404 on unknown tx) and compliance checks (PAN never in responses). Every test is tagged, e.g.:
- [REQ-PAY-API-001][COMP-PCI-001] initiate success, no PAN in payload
- [REQ-PAY-API-ERR-001] invalid amount (<= 0)
- [REQ-PAY-API-ERR-004] over-refund rejected
- …and so on
These tags enable traceability and later appear in compliance reports.
2) Run the suite locally and verify the gates
Install and run:
nvm use 20    # Node.js v20
npm i
npm test --silent
As shown in the snapshot below:
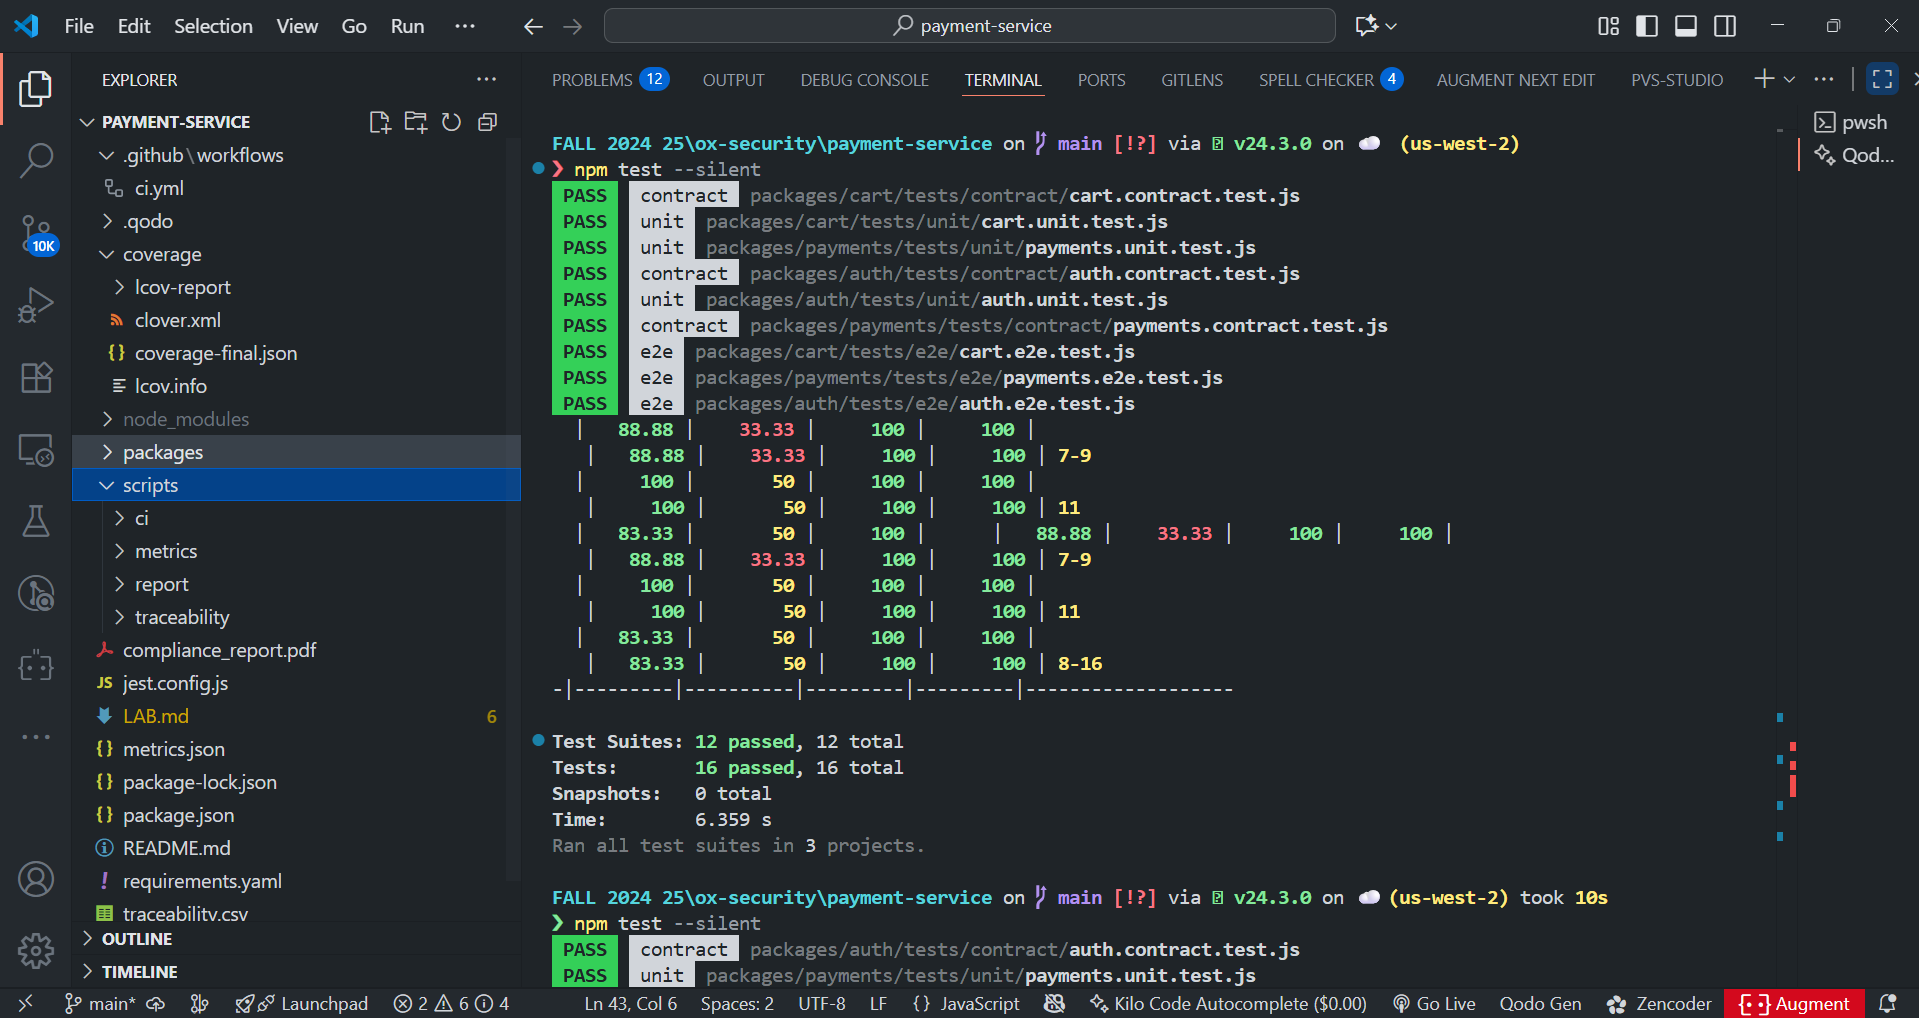
Observed output after running the test suites showed all 13 suites pass, with 23 tests executed:
- Test Suites: 13 passed / 13 total
- Tests: 23 passed / 23 total
The repo’s coverage gate (default 80%, enforced by scripts/ci/enforce-coverage.js) passes. If coverage dips below 80%, CI fails the build. Because the new tests are targeted, we increased detection without inflating suite time.
3) Wire traceability for audits
Traceability is automatic here:
- Requirements file: requirements.yaml (authoritative list)
- Tags in tests: [REQ-…] and [COMP-…]
- Extractor: npm run traceability:update
- Generates/updates traceability.csv by scraping tags from test names/comments.
This gives you a clean requirements → tests → results chain for auditors, and lets you answer “which controls are validated by executed tests?” without manual spreadsheets.
4) Compute enterprise metrics and generate the compliance report
- Metrics: npm run metrics
- Aggregates CI events, coverage artifacts, flake rates, pact/contract results (if present), and defect links into the warehouse/files under scripts/metrics/ and scripts/metrics/report/.
- Compliance PDF: npm run report
- Emits compliance_report.pdf with: requirement coverage, test mappings, pass/fail, coverage by module, and exceptions/waivers, if any. This is the artifact you hand to auditors.
5) Keep the pipeline clean: untested diffs + flake quarantine
Two mechanisms keep metrics trustworthy:
- Untested diffs: if a PR introduces new code without coverage, CI blocks the merge. This prevents “silent debt” from accumulating.
- Flaky quarantine: unstable tests are moved to quarantine with npm run quarantine:flaky, where they don’t block releases but are tracked until fixed. This keeps flake rate below 1%, making pass/fail signals reliable.
The result is a test suite you can act on without second-guessing.
What changed in the metrics (and why it matters)
- Risk-weighted automation coverage went up on critical payment paths without exploding test count. That improves the real signal per minute of CI time.
- DRE improves because more defects are caught pre-release (invalid amounts, over-refunds, missing currency/PAN rules). These are the defects that are costly if they escape.
- Compliance readiness is now demonstrable: requirement IDs in tests → traceability.csv → compliance_report.pdf. You can point auditors to executed evidence, not just intent.
- Cycle time stays healthy because we added a compact suite. You keep the regression under control instead of creeping into 10–14-hour runs.
- Coverage gate stays enforced (≥80%), but the meaningful win is branch-level checks in tricky logic and no PAN exposure assertions, metrics that actually map to risk.
Why is this different from “more tests”
Most enterprises fail when metrics drift into vanity reporting, thousands of test cases with no link to risk, flaky regressions nobody trusts, or compliance reports stitched together in Excel. In this walkthrough, Qodo turned those pain points into:
- Targeted automation coverage tied to risk.
- Real-time metrics in CI/CD, not after-the-fact reports.
- Audit-ready compliance evidence built automatically.
That’s the difference between tracking “how many tests we have” and knowing “our payment service cannot over-refund, cannot expose PANs, and every rule has a passing test linked to it.”
Building Enterprise Trust with Software Testing Metrics.
At enterprise scale, metrics stop being engineering trivia and become the backbone of trust. Executives use them to judge predictability and ROI, auditors use them as compliance evidence, and engineers rely on them to know their pipelines catch the right risks.
Shallow numbers, test counts, bug counts, and raw coverage only create noise. Actionable metrics such as Defect Removal Efficiency, flake rate, and requirements-to-test traceability build confidence at every level. Developers trust that their code is being validated against the right risks. Leadership can approve releases knowing delivery is predictable. Regulators see clear evidence that compliance requirements are tested and tracked.
The payments-service example showed this in practice: compact, requirement-tagged tests improved risk coverage without bloating suites, compliance traceability was automatic, and a one-click PDF delivered audit-ready proof. That’s what makes metrics more than numbers; they’re a system of accountability and trust. Qodo ensures those signals aren’t just collected, but aligned, auditable, and tied directly to business outcomes.
FAQs
Q: What are Calculated Metrics in Software Testing?
Calculated metrics are values derived from raw test data, often combining multiple signals into something actionable. For example, Defect Removal Efficiency (DRE) = defects caught pre-release ÷ (defects caught pre-release + defects found in production). Another common one is Mean Time to Detect (MTTD), which is computed from timestamps of when defects are introduced vs. when they are discovered. These aren’t logged directly; they’re calculated to reflect pipeline health or product reliability.
Q: What are Defect Metrics?
Defect metrics track the characteristics and lifecycle of bugs. Common examples include:
- Defect density: number of defects per KLOC or per service.
- Escaped defects: bugs that made it into production.
- Severity distribution: ratio of Sev-1 to Sev-3 issues.
- Stage containment: where defects were detected (unit, integration, staging, production).
Together, these metrics reveal where quality gaps exist and the cost associated with not addressing them early.
Q: Which is the Best Tool for Software Testing?
For unit testing, coverage, and reporting, Qodo is the best fit at enterprise scale. It goes beyond frameworks like Jest or JUnit by generating context-aware test cases, enforcing risk-weighted coverage, and producing compliance-ready reports out of the box. While Pact, SonarQube, and other tools play a role in specific layers (contracts, static analysis), Qodo integrates them into CI/CD pipelines and turns raw test data into actionable, auditable enterprise metrics.
Q: What is DDP in Testing?
DDP stands for Defect Detection Percentage. It measures how many total defects were detected during testing versus the total defects that exist (detected + later discovered in later phases or production). Formula:
DDP = (defects detected during test ÷ total defects) × 100
A higher DDP means testing is effective at catching issues before release. In enterprise environments, DDP is often tracked alongside DRE (Defect Removal Efficiency) to evaluate whether quality controls are actually preventing downstream failures.