10 Code Quality Metrics for Large Engineering Orgs: With Owners, SLAs, and Gates
TLDR;
- Code quality metrics are not about judging developers; they help reveal where the codebase is becoming harder to work with. When complexity, churn, or ownership gaps go unnoticed, small issues compound into rework and on-call load. With AI-written code now blending into daily development, these early signals matter more than ever.
- Most reliability problems don’t show up out of nowhere; they accumulate slowly in the same few modules. When churn, complexity, and defect density are tracked consistently, these patterns come up early, and these signals can be automated into CI pipelines or dashboards using tools like CodeScene, SonarQube, or GitHub Insights.
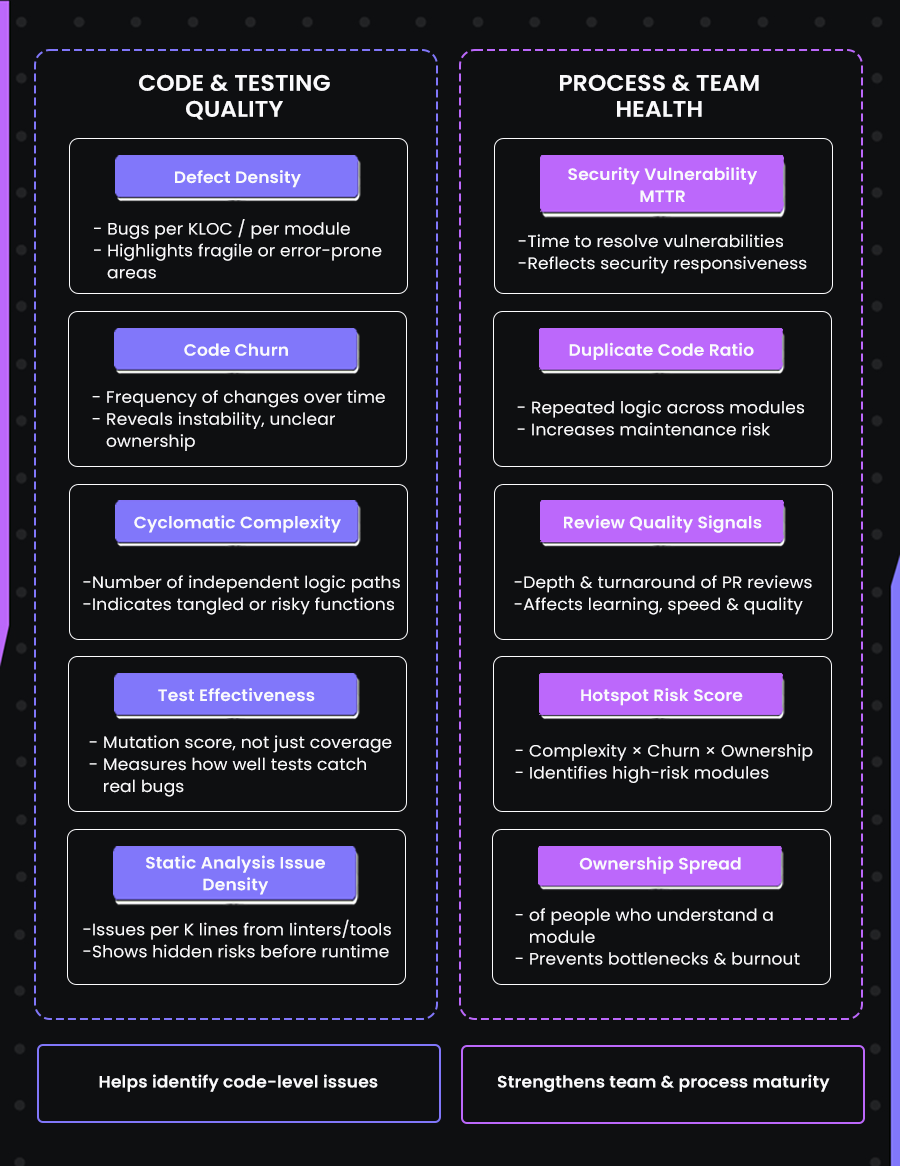
- The top 10 code quality metrics covered: Defect Density, Code Churn, Cyclomatic Complexity, Test Effectiveness, Static Analysis Issue Density, Security Vulnerability MTTR, Duplicate Code Ratio, Review Quality Signals, Hotspot Risk Score, Ownership Spread.
- AI speeds up coding, but speed without structural checks (like static analysis, architectural boundary validation, and automated complexity scoring) can push complexity into parts of the system that are already fragile. Metrics act as guardrails like churn thresholds, complexity alerts, and hotspot monitoring, helping teams ensure new changes align with existing domain logic and architecture.
- Code reviews are still the strongest point for shaping code quality, but manual review alone can miss context when systems are large or changing fast. Metrics help reviewers know where to slow down and where a light review is enough.
- Teams often debate where to invest cleanup and improvement efforts, but metric trends make the answer explicit. High-defect modules, high-churn files, and low-ownership areas show up clearly in the data. This removes guesswork and helps teams focus on changes that actually reduce long-term cost.
The 2025 Stack Overflow Developer Survey reports that more than 70% of professional developers now use AI coding tools every week, yet 48% of engineering leaders say code quality has become harder to maintain as AI-generated changes increase. On top of that, many organisations are encountering what is more and more referred to as the AI velocity gap: coding fastens, but the supporting delivery systems do not.
As Trevor Stuart, GM at Harness, noted, “The AI Velocity Paradox is real. Teams are writing code faster, but shipping it slower and with greater risk.”
Across the enterprise perspective, this is showing up as more defects in downstream stages, higher cloud consumption from inefficient code paths, and broader security exposure when quality checks are inconsistent. The underlying issue is that automation is concentrated at the point of code creation, while testing, validation, and deployment still rely heavily on manual processes. Organisations only see material performance improvements when automation and quality controls extend across the entire delivery lifecycle.
I view code quality metrics as the only practical early-warning system for this gap. They reveal where stability starts to weaken long before issues come into production. For example, code churn measures how often a file changes compared to its size. If the same part of the code keeps getting edited, it usually means the logic is unclear or the boundaries are weak.
A Microsoft Windows Server study found that high-churn modules often create more bugs. Tracking metrics like churn, complexity, and review speed helps teams spot weak areas early and fix them before they grow into bigger issues.
This need for visibility has grown sharply as AI-assisted development becomes routine. Teams may generate code faster, but many enterprises report that the downstream cost of validating and correcting AI-generated changes is rising. Without clear metrics, the impact shows up late as rework, incident volume, or performance regressions rather than during development, when it is cheaper to mark. It is better to pair those tools with platforms like Qodo, which add governance, enforce team patterns, and maintain code quality across every layer of the development process.
In this blog, I am going to discuss the top 10 code quality metrics that I believe engineering managers should track to strengthen maintainability, reduce long-term risk, and improve team execution consistency.
Top 10 Code Quality Metrics For Enterprises
Below are some of the most widely adopted code quality metrics that engineering managers should be aware of, while also knowing which one to use under what conditions:
1. Defect Density (bugs per thousand lines of code or per module)
Defect density shows how many confirmed bugs come from a specific module relative to its size. The goal is to spot parts of the codebase that are harder to maintain, not to measure developer performance. A small “helpers” file that keeps breaking deserves more attention than a large service that rarely causes issues. Normalizing by size removes guesswork and makes conversations about quality concrete.
Example
I had a ~350-line currency rounding file in a checkout service. It kept showing up in every pricing-related incident. Over time, different contributors (including AI-assisted ones) added conditions that made the behavior inconsistent. Once I looked at defect density across modules, this file stood out immediately. I didn’t “optimize” it; I rewrote it with clear rules and property-based tests. The bug reports from that area stopped.
You can quickly get a rough view of defect-prone files using commit history:
# Files most frequently touched in bug-fix commits (assuming "fix:" in commit messages)
git log --all --grep="fix:" --name-only --pretty=format: |
  sort | uniq -c | sort -nr > bug_files.txt

# Count lines of code
cloc . > loc_report.txt
Then compute in a spreadsheet or query:
defects per KLOC = number_of_bug_fixes / (LOC / 1000)
Impact for Teams
Tracking defect density helps teams make better decisions about where to invest effort. Instead of having endless debates about “which part of the codebase needs cleanup,” defect density shows exactly where failures are concentrated. It lets you focus code review time, testing, onboarding guidance, and refactoring energy on the modules that actually cause production issues. It also depersonalizes the discussion; you can talk about code, not people.
Teams bring this up by correlating bug-fix commit frequency with LOC in dashboards or reports, tools like SonarQube, CodeScene, GitHub Insights, or even a simple spreadsheet can highlight which files consistently trigger incidents. Once those modules are visible, refactoring and test improvements become targeted rather than speculative.
When to Use It
- During sprint retros, to pick which modules need cleanup or redesign
- Before release planning, to reduce risk in areas that frequently break
- During technical debt sessions, to prioritize based on real impact rather than intuition or memory
- When introducing AI-generated code, to monitor its real-world effects
- When onboarding new engineers, to direct mentorship to known tricky areas
Strategy: Stabilize High-Churn Modules with Qodo
Every codebase has “hotspots”, specific modules that change frequently and break disproportionately often. These areas are usually where technical debt turns into production outages. Manual review often fails here because reviewers are too fatigued to spot minor logic gaps in complex, changing files.
How to use Qodo here: Instead of just reviewing these files harder, use Qodo to build a permanent safety net around them:
- Use Qodo to flag missing validation or boundary errors while the code is still being written. It is significantly cheaper to fix these issues before they reach the pull request.
- When Qodo detects that a specific bug pattern has been fixed multiple times, it learns to flag that pattern automatically. This prevents new contributors from re-introducing old bugs simply because they lack context.
- Use the recurring suggestion data to spot architectural drift. If a module triggers constant logic warnings, you have data-backed justification to pause feature work and refactor.
2. Code Churn (frequency of code changes over time)
Code churn measures how often a file or module is modified within a given time window. It tracks additions, deletions, and rewrites. A high-churn file is one that keeps changing repeatedly. This often means unclear requirements, weak boundaries, or logic that tries to handle too many responsibilities at once. Churn is a strong early signal because code that changes constantly tends to be where bugs, regressions, and operational noise originate.
Code churn measures how often a file or module is modified within a given time window, and the meaningful version of this metric is normalized churn, calculated as (lines added + lines deleted) / total lines in the file. Normalization matters because a 40-line file changing 10 lines is a much bigger signal than a 2,000-line file changing 10 lines.
High churn usually points to unclear requirements, weak interfaces, or logic that’s trying to handle more responsibility than it should. Churn is a strong early predictor of instability: the parts of the codebase that change the most frequently are often the same places where regressions, hidden bugs, rollout failures, and on-call incidents originate.
Example (real scenario)
We had a “feature_flags.js” file that was touched in almost every sprint. Each new experiment added another conditional branch, toggle, or override. It looked simple, but the behavior was hard to reason about, and rollout incidents were common.
I plotted normalized churn over four sprints as a simple bar graph in GitHub Insights, and that file stood out immediately as the outlier. We broke the logic into smaller, explicit flag resolvers and documented the valid input states. After that, churn dropped, and rollout issues stopped showing up in that area.
You can get churn per file like this:
# Churn per file for the last 30 days
git log --since="30 days ago" --numstat --format="" |
awk '{added[$3]+=$1; deleted[$3]+=$2;} END {for (f in added) print f "," added[f]+deleted[f];}' |
sort -t, -k2 -nr > churn_report.csv
Impact for Teams
Churn reveals instability before bugs show up. If a file changes every week, you don’t need to wait for the incident report to know something is off. It also stops opinion-driven refactoring debates. Instead of “this code feels messy,” churn data shows where maintainability is already failing. In AI-assisted environments, churn helps distinguish fast-typed code from stable logic. If AI speeds up output but churn rises afterwards, the team knows it is accumulating friction rather than shipping durable solutions.
Churn also helps with planning. High-churn areas slow onboarding because intent shifts faster than documentation. By lowering churn in the key components, you make the entire system easier to work on.
When to Use It
- During sprint retros to identify modules that need redesign rather than more patching
- Before release freeze periods, to reduce last-minute regression risk
- In code review discussions, to justify refactoring work with data instead of opinions
- When adopting AI code suggestions, to monitor whether the pace of change stays controlled
3. Cyclomatic Complexity (number of independent logic paths in a function)
Cyclomatic complexity measures how many possible paths exist through a piece of code based on conditionals, loops, and branching. Higher complexity means the logic is harder to read, review, test, and modify safely, even if the function “works.” It’s not just a subjective clean-code idea; the metric is mathematically defined (McCabe, 1976) as M = E − N + 2P, where E is the number of edges, N the number of nodes, and P the number of connected components in the control-flow graph. When a function’s code complexity rises, it’s usually a sign that it’s handling multiple responsibilities and should be split into clearer, single-purpose steps.
When a function has many branches, every change requires re-analyzing all possible paths. This is where silent bugs hide, especially with AI-generated code that may introduce nested conditionals that look correct but aren’t aligned with business rules or edge behavior.
Example (real scenario)
We had a process_order() function in a backend microservice that handled discounts, payment type rules, and tax region overrides. It was ~120 lines. When we ran a complexity check, it scored 21. That explained why every small pricing tweak caused unexpected behavior in edge cases.
No amount of “more tests” helped because the logic itself was tangled. We broke the function into smaller, single-purpose functions: compute price, validate order, apply tax, finalize state. Complexity dropped, test clarity improved, and debugging time went down noticeably. Here’s a quick way to check complexity in Python, for example:
# Requires radon
pip install radon

# Show complexity breakdown for a file
radon cc order_processor.py -s -a
Complexity scores above ~10-12 are worth reviewing, and scores above ~20 usually signify that the function is taking on too many responsibilities and should be refactored. Similar tools exist for most languages: for example, gocyclo for Go, eslint-plugin-complexity for JavaScript/TypeScript, flake8-cognitive-complexity for Python, and PHP Mess Detector for PHP, so the same practice applies regardless of stack.
Impact for Teams
Lowering complexity improves code review quality and reduces the time needed to understand changes. It also lowers the chance that a small modification breaks an unrelated scenario. In codebases where AI is involved, complexity checks act as a guardrail. AI sometimes suggests solutions that work but are structurally messy. Complexity gives teams a straightforward way to say, “We need to simplify before shipping.”
It also helps with onboarding. New engineers ramp faster when key logic is broken into small, named steps rather than one all-purpose function with branching everywhere.
When to Use It
- During code review, to justify refactoring instead of patching
- When onboarding new contributors, identify logic that needs explanation or cleanup
- Before extending a function, if complexity is already high, refactor first
- When using AI-generated code, scan for large conditional blocks, rewrite before merging
4. Test Effectiveness (not just coverage).
Test coverage tells you whether code is executed during tests, but it does not tell you whether the tests actually catch failures. This is why high coverage can still coexist with bugs in production. Test effectiveness focuses on whether tests assert correctness under real conditions, edge cases, invalid input, concurrency, error handling, not just the “happy path.”
A useful way to measure this is mutation testing: intentionally introduce small changes (mutations) in the code and see how many of them are caught by your tests. If many mutations slip through, the tests are shallow, even if coverage is high.
First-hand example
I once had a data serialization function that showed 91% line coverage. It looked solid. But bugs kept appearing in scenarios involving timezone conversions. When I ran mutation testing, the score was only 43%, meaning more than half of the small logic changes didn’t trigger test failures. The coverage number made the tests look good, but the effectiveness exposed what was actually happening: the tests only checked the simplest case, not the realistic boundaries.
After rewriting a few tests to focus on edge behavior (daylight savings, UTC offsets, invalid timestamps), the mutation score rose, and the production issues stopped. The code didn’t change; only the tests became meaningful.
Here is one way to check test effectiveness in a Python project:
# Install mutation testing tool
pip install mutmut

# Run mutation testing on your project
mutmut run
mutmut results
A score below ~60–70% usually means the tests are only exercising the code, not validating it.
Impact for Teams
Test effectiveness closes the gap between “tests exist” and “tests protect us.” It helps stop bugs from slipping past review and appearing during releases. This is especially important when AI-generated code is involved, because AI often produces logic that works in one scenario but fails quietly under edge conditions. Effective tests make those failures visible before they hit production.
It also reduces on-call stress. When tests fail for the right reasons, you avoid firefighting later. This directly improves reliability, which helps both engineers and product teams.
When to Use It
- Before major releases, to ensure critical behavior is actually protected
- When a module has high coverage but still causes bugs
- When introducing AI-generated or AI-assisted code into key logic
- When onboarding new contributors, effective tests act as documentation
5. Static Analysis Issue Density (number of analyzer findings per module, normalized by size)
This metric looks at how many issues your static analysis tools flag in a module, adjusted for how large that module is. The transition from test effectiveness to this metric is natural: tests catch behavior problems you expect, while static analysis catches problems you may not have noticed at all, null-safety risks, unhandled errors, type mismatches, unsafe input handling, insecure defaults, and so on. The goal isn’t to chase a “zero warnings” scoreboard. The value is in seeing where risk clusters before it shows up as defects or security incidents later.
First-hand example
I had a service where everything looked clean in tests, and production bugs were minimal. But when I turned on stricter static analysis rules (including framework-specific linters), one module lit up with null-safety and unchecked input warnings.
This was a user profile update handler that wasn’t validating nested fields properly. It had quietly accumulated assumptions over time. Static analysis density made that clear. I rewrote the input parsing into a small validation layer, and the risk was reduced a lot. That cleanup took less time than the next two incidents would have cost.
Here’s a quick way to generate issue density data per file using ESLint as an example:
# Output all lint issues as JSON
eslint src --format json > lint_report.json

# Count issues by file
jq -r '.[] | .filePath' lint_report.json | sort | uniq -c | sort -nr > lint_counts.txt

# Count LOC for comparison
cloc src --csv > loc_report.csv
You can join these in a spreadsheet to compute issues per 1,000 lines.
Impact for Teams
Static analysis density helps decide where to tighten review effort. It reduces noise during code review because smaller, mechanical issues get caught automatically. It also builds trust in automation. When developers know that static checks are accurate and relevant, they rely on them instead of ignoring warnings. This matters more with AI-generated code, because AI often writes correct-looking code that skips validation or assumes input format stability. Static analysis becomes the first filter to catch those blind spots.
This metric also prevents “alert fatigue.” If issue counts drop over time and noise decreases, teams are more likely to respond to future warnings promptly. That directly lowers security and reliability risk.
When to Use It
- During onboarding or handover of legacy modules, to see where safety gaps are
- Before refactoring, to understand hidden assumptions in the code
- When introducing new languages or frameworks, to calibrate linting rules early
- When adopting AI-generated code, to automatically enforce safe and consistent patterns
6. Security Vulnerability Resolution Time (MTTR – how long a vulnerability stays open)
This metric tracks how long it takes to fix a reported security issue from the moment it’s detected. The transition from static analysis to this one is simple: static analysis shows potential weaknesses, while MTTR shows how quickly the team handles real security risks once they are known. The focus here is not on counting vulnerabilities, but on whether the team can respond before the problem becomes expensive or exploitable.
A shorter MTTR means your security process is working: ownership is clear, priorities are understood, and the fix path is unblocked. A long MTTR usually means a mix of unclear ownership, fear of touching fragile code, or security fixes consistently losing to feature work in planning.
First-hand example
I once noticed that our average time to fix a high-severity auth issue was around 10-12 days. Not because the fixes were complicated, but because nobody felt like they “owned” the affected module. People assumed security would step in.
Once I started tagging vulnerabilities with a clear code owner at the moment of detection and introduced a simple rule that high-severity issues must be fixed within 5 working days, MTTR dropped quickly. It wasn’t about pressure; it was about visibility and shared responsibility. After that change, we stopped having the same class of bugs reappear during audits.
To get MTTR, most teams can use the timestamps from their issue tracker:
SELECT AVG(DATEDIFF(day, created_at, resolved_at)) AS avg_mttr_days
FROM issues
WHERE severity = 'high';
Even a rough estimate across a quarter is enough to reveal a trend.
Impact for Teams
Lower MTTR reduces the likelihood of security incidents becoming production incidents. It also reduces stress on developers because issues don’t linger in the background as silent liabilities. When MTTR is healthy, the team trusts its ability to handle risk.
And in environments where AI assists with coding, MTTR becomes even more important. AI can generate code that looks fine but skips validation or sanitization. That means security gaps can appear earlier and more quietly. A strong MTTR process prevents those gaps from becoming legacy problems that are difficult to unwind later.
This metric also helps leadership decide where to invest: if MTTR is consistently high in one part of the codebase, that area likely needs clearer ownership, clearer design, or simplification.
When to Use It
- During release planning, to decision which modules need review before going live
- When onboarding AI-generated code into security-sensitive services
- During quarterly retros, check whether security fixes are being deprioritized
- While defining code ownership, ensure that each module has someone accountable for closing issues
7. Duplicate Code Ratio (how much logic is repeated across modules)
This metric looks at how often the same or very similar logic appears in multiple places. The transition from MTTR to this metric is natural: slow vulnerability fixes often happen in code that has been copied around because every duplicated block needs to be patched separately. Duplicate code is not just a style issue; it increases the cost and risk of every future change.
When logic is duplicated, any bug fix, rule update, or security patch has to be repeated in all those places. If one copy gets missed, you have inconsistent behavior and hard-to-trace bugs. AI-assisted coding can make this worse because AI tends to repeat patterns it has already seen rather than abstract them cleanly.
First-hand example
I once had a discount calculation rule appear in three different services, slightly modified in each one. I didn’t notice the duplication until a pricing change rolled out and created different totals depending on which flow the customer went through. I tried fixing one instance, then realized the same logic was hiding in two other modules.
From that point on, instead of trying to “synchronize” the logic manually, I pulled the rule into one shared pricing function with clear inputs and tests. Once that single source of truth existed, bugs stopped appearing in that area because there was only one place to update.
To detect duplicates quickly, you can use a built-in duplicate finder in tools like PMD, SonarQube, or even a basic diff scan:
# Example using jsinspect for JavaScript/TypeScript
npm install -g jsinspect

jsinspect src/
This will highlight blocks of code that are suspiciously similar.
Impact for Teams
Duplicate code increases long-term maintenance costs. Every change takes longer, every bug fix carries more risk, and reviews become less reliable because the logic is scattered. Consolidating duplicates makes the codebase predictable and easier to reason about.
This is especially helpful when AI-generated code is part of the workflow. AI is great at producing “working code quickly,” but it does not always know the project’s architectural boundaries, so it may recreate similar logic instead of reusing existing components. Tracking duplication helps ensure that code stays consistent and traceable instead of slowly diverging.
Decreasing duplication also improves onboarding. New engineers learn faster when main logic exists in one place with clear intent rather than scattered copies with small differences.
When to Use It
- Before adding new features that depend on shared business rules
- When refactoring legacy services or merging duplicated flows
- After periods of sudden development or experiments (copy-paste debt grows fastest here)
- When introducing AI-assisted coding, to avoid logic drift across modules
8. Review Quality Signals (depth and turnaround time of pull request reviews)
This metric looks at how code review actually works in day-to-day life, not just whether reviews happen, but how useful they are. The transition from duplicate code to this metric makes sense: duplication often appears when reviews are rushed or shallow. Review quality signals include: how long it takes for someone to respond to a PR, how many meaningful comments are made, whether reviewers read the change in context, and how often back-and-forth revisions happen.
A fast but shallow review is almost the same as no review. A slow review discourages collaboration and causes merge conflicts. The sweet spot is quick acknowledgement and thoughtful feedback. When review depth drops, minor bugs slip through. When turnaround time balloons, code goes stale and is harder to merge.
First-hand example
I once noticed that my PRs were taking about 2–3 days to get reviewed. By the time someone looked at them, I had already switched context, moved on to another task, and forgotten the details. Reviews became mechanical and shallow because everyone was rushed. I suggested a simple practice: respond to new PRs within the first working hour, even if the full review comes later.
That one change kept the context fresh. Review conversations became more direct, less defensive, and more focused on design instead of syntax. The number of follow-up fixes after the merge dropped because reviews were happening when the code was still “warm” in everyone’s mind.
You can pull review timing and comment depth from your platform’s API. For GitHub, for example:
# Example: pull review timestamps via GitHub CLI
gh pr view <PR_NUMBER> --json reviews --jq '.reviews[] | {author: .author.login, submittedAt}'
Depth can be roughly inferred by counting comment threads versus total files changed.
Impact for Teams
Strong review habits create predictable quality. They avoid bugs, reduce rework, and help avoid “tribal knowledge silos.” Good reviews also improve team alignment: engineers learn patterns, naming, expectations, and edge cases just by reading others’ work.
When AI-assisted code is involved, review quality becomes even more important. AI can create correct-looking code that hides logical or security assumptions. A thorough review catches those before they become incidents. Review depth is where you guard architectural consistency, input validation, resource use, and data boundaries.
Review turnaround also affects delivery speed. Short, thoughtful reviews keep the development flow smooth and reduce context switching. Long review delays are one of the biggest hidden productivity drains in engineering teams.
When to Use It
- During sprints, as a live signal of whether the team is overloaded
- When onboarding new engineers, deeper reviews speed up learning
- When allowing AI code suggestions, reviews help verify correctness and intent
- Before major feature releases, tighter review loops reduce release risk
9. Hotspot Risk Score (complexity × churn × ownership concentration)
This metric combines three earlier signals: how complex a module is, how often it changes, and how few people understand it. The transition here is straightforward: if review quality tells you how code moves through the team, hotspot risk tells you where the code is likely to break next. A hotspot is a file or module that is both frequently modified and hard to understand, usually with only one or two people who can confidently make changes to it.
The score doesn’t need to be mathematically perfect. The point is to highlight places in the codebase where risk is stacked. A high-risk hotspot is a file that is changing constantly (high churn), hard to reason about (high complexity), and has low ownership (only one or two contributors ever touch it).
First-hand example
I had a module called account_reconciliation.py that processed user credits and refunds. It was around 500 lines, nothing unusual. But every release cycle, someone had to touch it; the logic was branching in multiple directions, and only I really understood how the rules were meant to behave. Any change requires careful mental simulation just to avoid breaking something else. Once I mapped churn + complexity + contributor count, this file was the highest-scoring hotspot in the codebase.
I didn’t fix it by rewriting everything at once. I started by isolating one piece of logic into a clear function with a good name and tests. In the next sprint, I did the same with another cluster. Over a few cycles, that file went from something only I could change to something anyone on the team could work with confidently.
To compute hotspots quickly:
# Churn
git log --since="60 days ago" --numstat --format="" |
awk '{c[$3]+=$1+$2} END {for (f in c) print f","c[f]}' > churn.csv

# Complexity (example for Python)
radon cc src/ -j > complexity.json

# Ownership count
git bugreport --no-mailmap # or summarize `git blame` contributors per file
Impact for Teams
Hotspots are where production bugs originate and where on-call pain comes from. By identifying them early, teams avoid firefighting later. Lowering hotspot risk spreads knowledge, shortens debugging time, and reduces dependency on “that one engineer who knows that one module.”
This also matters when AI-generated code is in use. AI can speed up writing new code, but hotspots slow everything down. If a hotspot remains untouched structurally and AI keeps adding new logic into it, complexity snowballs. Hotspot scoring gives you a simple rule: fix structure before adding behavior.
It also helps with planning. Instead of trying to refactor everything, you refactor only the modules that actually cause downstream pain.
When to Use It
- Before feature development touches a risky part of the system
- When deciding where to allocate refactoring time each sprint
- During staffing or onboarding discussions, hotspots are blockers to shared understanding
- When AI is generating new code, avoiding complexity grows silently
10. Ownership Spread (also known as Bus Factor)
Ownership spread looks at how many people can confidently understand, modify, and troubleshoot a specific module. The transition from hotspot scoring to this metric is natural: once you know where the risky areas are, the next question is who actually understands them. If only one person knows how a part of the system works, you have a bottleneck. If that person is unavailable during an incident or a key release moment, the entire team slows down or stalls.
This isn’t about forcing everyone to know everything. It’s about making sure critical logic is not isolated in one person’s head.
First-hand example
I once maintained an internal billing calculator that had grown organically over time. I understood the rules well and could make changes quickly, but nobody else touched the file for months. During a production issue on a day I wasn’t working, the team had to wait for me to come online to debug it. That wasn’t their fault; the ownership imbalance was the real problem.
To fix it, I started pairing with another engineer when making changes. We walked through the logic, rewrote small pieces to be clearer, and added a short doc explaining the inputs and expected outputs. After two sprints, that person could work on the file confidently. After another sprint or two, a third person could. Incidents stopped requiring me, and the system became healthier.
If a critical file shows one name or a heavy majority, ownership is too narrow. A simple way to estimate ownership spread:
# Count contributors per file
git blame --line-porcelain <file> | sed -n 's/^author //p' | sort | uniq -c
Impact for Teams
Low ownership spread slows development and increases risk. When only one person understands a module, code review becomes weaker because no one has enough context to challenge assumptions. On-call rotations become stressful. Feature development slows because changes require that one person be available.
Increasing ownership spread distributes knowledge, reduces pressure on senior engineers, and makes the codebase easier to maintain long-term. This matters even more when AI tools are being used, because AI-generated code can quickly accumulate in areas that are already poorly understood. If ownership is low, the team may not notice when AI suggestions introduce inconsistencies or unsafe assumptions.
Improving ownership spread is often low-cost: pair on changes, write real examples in docs, split large functions, and walk through logic in code review instead of just approving it.
When to Use It
- During incident response reviews, ask “who could have handled this besides the person who did?”
- When onboarding new engineers, use hotspot modules as guided learning areas, not something to avoid
- When planning refactors, prioritize parts of the system that only one person understands
- When integrating AI-generated code, ensure someone with context reviews and can explain the logic afterwards
Why Code Quality Has to Be Maintained Throughout the SDLC (Not Just at One Stage)
Code quality is shaped constantly throughout the development cycle. If clarity and structure are not maintained early, the codebase becomes harder to change later. A small fix during development can turn into a longer effort once the change is wrapped in tests, integration paths, and release steps. Keeping quality in focus throughout the SDLC helps avoid unclear logic and quiet architectural drift from turning into accumulated technical debt.
Code review is one of the most effective points of quality control. This is where someone checks whether the code aligns with the system’s expectations and whether the intent is understandable. Code reviews have more influence on long-term maintainability than any single metric.
Reviews help:
- Keep architectural and naming patterns consistent
- Maintain clear boundaries between modules and responsibilities
- Validate reasoning, not just output
- Spread understanding so no single person is the only one who knows how something works
- Catch complexity build-up before it turns into a larger refactor
Manual code reviews, however, can vary in depth depending on time pressure and how familiar the reviewer is with the surrounding code. Reviewers often only see what is in the diff, not how the change interacts with similar logic across the project. Minor issues can slip through for this reason. AI-assisted code review platforms mark the context gap. They analyze changes in relation to the entire repository, not just the file being modified. They can:
- Identify when new logic does not match how similar logic is handled elsewhere
- Highlight missing validation or error handling
- Apply team-specific patterns and conventions that have already been established
Human reviewers focus on correctness, domain understanding, and how the change fits into upcoming work. The AI system provides structural and consistency checks that benefit from full-repository awareness. The combined effect is faster reviews, fewer regressions, and a codebase that remains understandable as it grows.
How AI Code Review Platforms Like Qodo Help?
AI code review tools point out the main constraints of manual code review: limited context, uneven review depth, and bottlenecks caused by reviewer availability. Instead of analyzing code only at pull requests, these platforms analyze changes constantly across the codebase, using repository-wide patterns rather than isolated diffs. This allows issues to be caught where they originate, not after they spread into surrounding logic.
Platforms like Qodo operate across the SDLC rather than as a single gate. During development, they highlight deviations from established patterns, missing validations, or unsafe assumptions directly inside the editor; this is the shift-left effect. Developers get corrections early, before the code reaches review.
At review time, the platform highlights architectural drift, hidden coupling, or repeated logic by comparing the new code to similar patterns elsewhere in the system. This reduces the likelihood of merging changes that introduce complexity or inconsistency.
Another feature that I like about Qodo is the one-click remediation that reduces the cost of fixing the issue. Instead of only pointing out the problem, the platform provides an adjustment already aligned with the team’s conventions. The suggestions are not generic; they are generated from the project’s own structure, previous commits, and preferred abstractions. This keeps the codebase consistent and avoids logic forks that come from copy-pasted fixes.
For enterprise teams, the advantages are impressive:
- Code review becomes more consistent because the platform applies the same checks every time.
- Architectural patterns are enforced automatically, lowering drift across squads or services.
- Onboarding time decreases since new engineers learn conventions through suggestions rather than tribal knowledge.
- Security-sensitive logic gains routine scrutiny, not periodic attention.
- Review latency falls because the reviewer no longer needs to manually detect mechanical or pattern-matching issues.
First Hand Example
To get a practical sense of how AI code review tools work in real conditions, I asked Qodo to analyze a small backend change where I had added a few new request handlers. The PR looked straightforward. It passed tests, and the logic was correct. I mainly wanted a second pair of eyes to confirm nothing was off.
What Qodo surfaced was the type of feedback that often slips past manual review when everyone is moving fast:
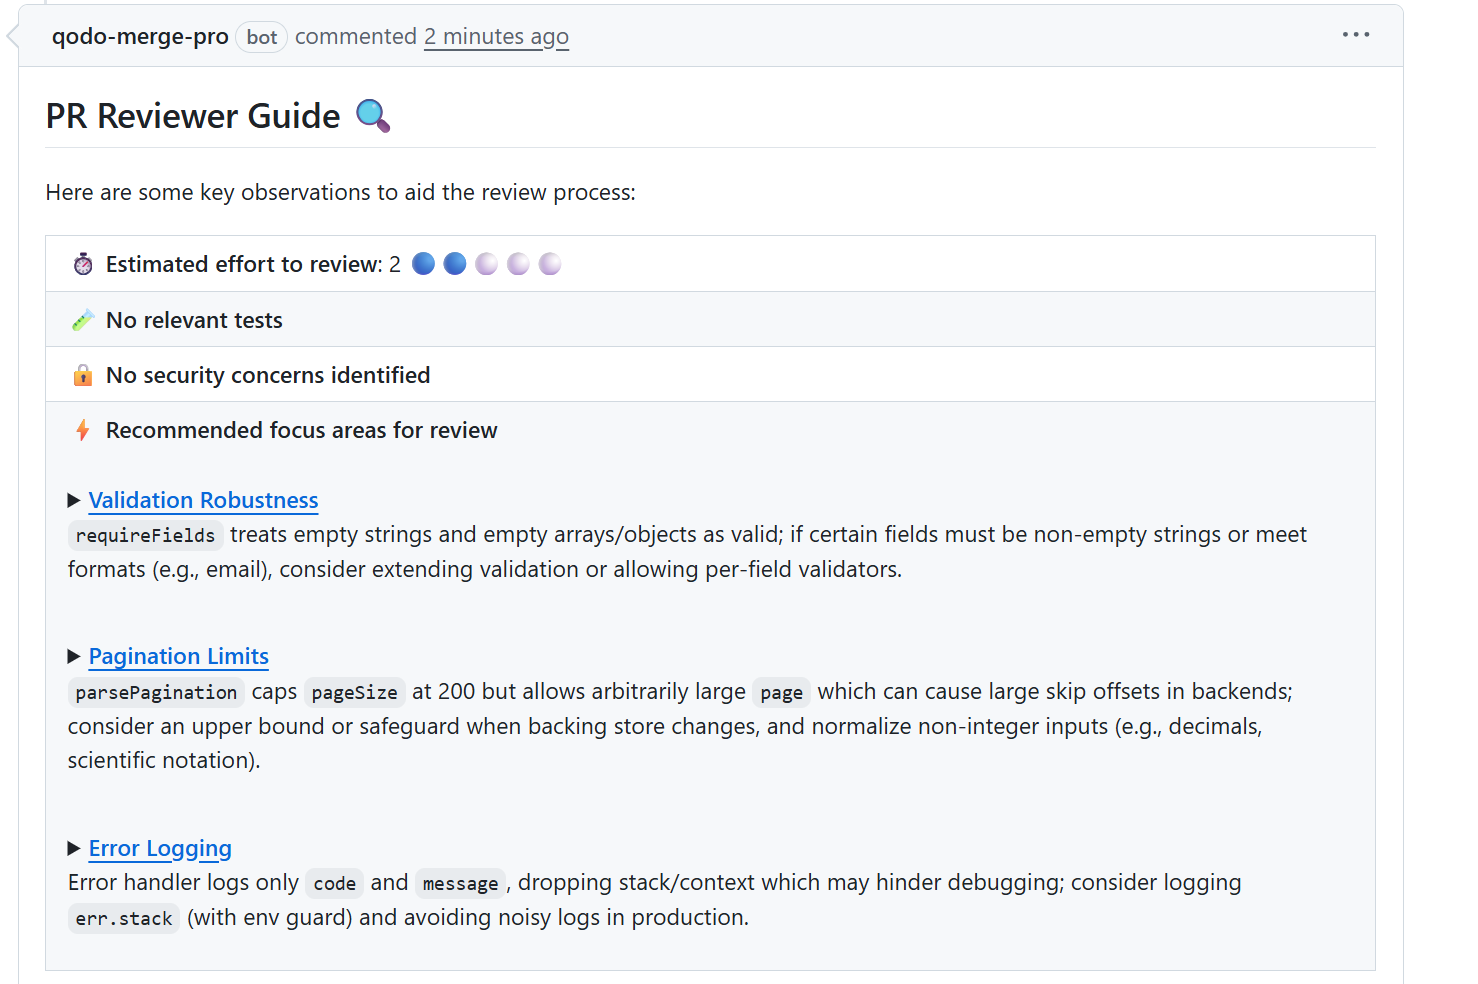
- It pointed out that my required fields check treated empty strings and empty objects as valid. In the context of this service, those values should be rejected. This would have likely shown up later as user-facing bugs.
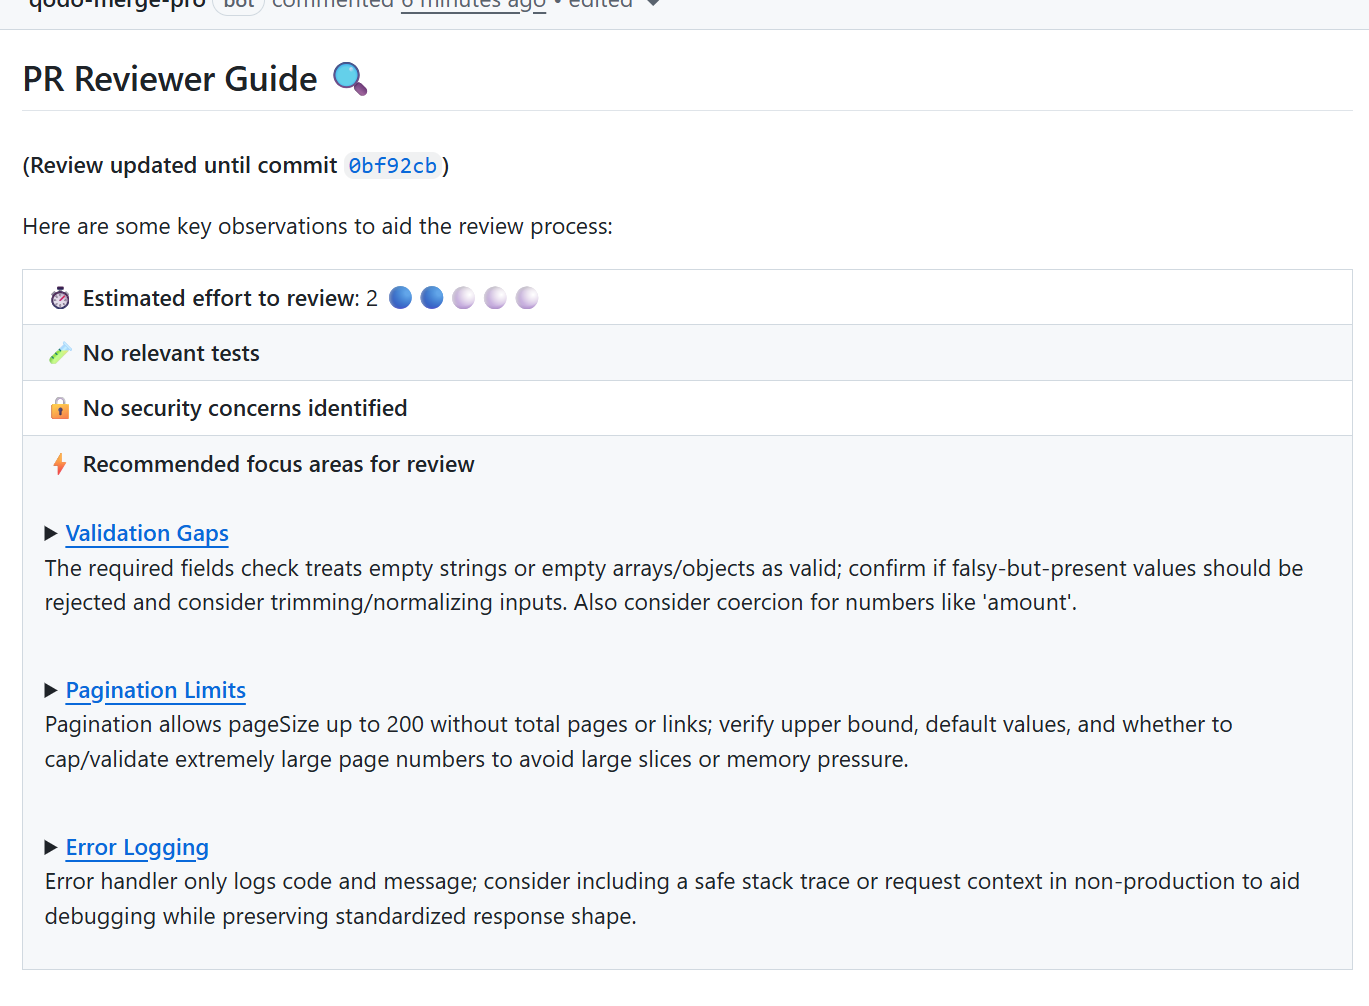
- It highlighted pagination handling. The default pageSize had an upper guard, but page did not. That could lead to large skip offsets if someone passed a very large page number. I hadn’t thought about that case at all.
- It flagged the error handler for only logging code and message, dropping the stack context. In a production debugging scenario, that would have slowed down incident response.
None of these were syntax errors, and none would have failed tests. There were small correctness and maintainability gaps that are easy to overlook when reviewing the diff manually. The value here was context; Qodo reviewed the change against how the rest of the codebase works, not just the lines I added.
I could have caught these issues later during a release review or, worse, during on-call. Instead, they surfaced while the change was still in progress and were easy to correct. That’s the difference AI brings when it reviews with repository-level awareness, not just pattern matching on a single file.
Conclusion
Code quality metrics work best as early signals, not scoreboards. They show where clarity is slipping, where logic keeps breaking, and where the team is relying on tribal knowledge instead of shared understanding. Used consistently, they reduce rework, cut down on on-call friction, and keep the codebase predictable as it grows.
As AI-generated code becomes standard, this feedback loop matters even more. Code can be written faster now, but correctness, reasoning, and maintainability still depend on careful review. Metrics help teams focus their attention, and AI-assisted review tools help highlight issues before they turn into operational problems.
The goal isn’t to chase perfect numbers. It’s to keep the system understandable, stable, and safe to change, so engineering speed stays sustainable over time.
FAQs
What is a KPI in code quality?
A KPI (Key Performance Indicator) measures the health of your software, such as how often a module breaks (defect density) or how often it is rewritten (code churn). Qodo help here because it doesn’t just measure these numbers, it actively improves them by catching regressions in the IDE before they become permanent statistics.
How does Qodo improve code review quality?
Standard tools only check the lines you changed, missing the bigger picture. Qodo is unique because it reviews changes with full repository context. It understands how your new code interacts with existing logic across the entire codebase, identifying deeper integration issues that human reviewers often miss due to fatigue.
Does Qodo replace human reviewers?
No. It handles the “robotic” work, checking for edge cases, null pointers, and validation gaps, so your engineers can focus on complex design and business logic. It makes Qodo the best partner for teams looking to speed up approval cycles without lowering their standards for safety.
How does Qodo help enterprises specifically?
Large organizations struggle with consistent coding standards across different teams and time zones. Qodo solves this by learning your specific codebase patterns and enforcing them globally. It acts as an automated guardian that prevents architectural drift, ensuring a new hire’s code matches the quality of your founding engineers.