How to Measure Engineering Productivity in Large, Distributed Teams
TL;DR
- Large teams slow down due to review bottlenecks, unclear ownership, cross-repo coupling, and verification overhead, not because engineers write code more slowly. Tools like automated code review help reduce that load by catching issues before reviewers ever see the PR.
- AI assistants increase code generation output but also increase verification cost, making experienced developers up to ~19% slower without proper guardrails.
- The metrics that actually matter at scale are PR cycle time, lead time, CFR, MTTR, and business impact, not story points or LOC.
- Productivity improves when CI is fast, ownership is explicit, quality checks are automated, and engineering and product align around the same delivery constraints.
- Qodo reduces review load by automating context gathering and verification, catching issues before humans review the PR and making delivery predictable even in large, distributed teams.
When you grow from 20 engineers to 200, the problems shift. Early on, productivity issues are mostly technical, flaky tests, unreliable deploys, and missing observability. But at scale, the real bottlenecks move out of the codebase and into the organisation. On a larger scale, they become systemic.
Code changes slow down not because engineers are less capable, but because the organisation can’t move code from idea to production without hitting issues like review bottlenecks, unclear ownership, inconsistent standards, and too many integration points across teams and services.
That friction compounds when tools meant to help, like AI coding assistants, introduce more complexity under the hood. A recent post from The AI Showdown 24×7 laid this out bluntly:
“AI coding assistants are making devs slower.”
Why your AI co-pilot is making you 19% slower (and you love it).
The headline reflects what many internal engineering reports are showing: while developers feel faster using AI tools, controlled tests reveal something else. Experienced engineers are often 15–19% slower when AI is in the loop. The issue isn’t the suggestions, it’s what follows. Developers end up spending more time validating that the AI’s code actually works: checking for logic bugs, fixing style issues, filling in missing tests, and resolving hidden security problems. That’s verification overhead, and it adds real cost in large systems where code has to meet high quality and stability standards.
So if teams are writing more code, but spending more time cleaning it up or fixing post-merge breakage, is that productivity? Not really. Measuring developer activity tells you very little in that case. What matters is how efficiently a team can develop maintainable software, and how predictably they can do it at scale.
That’s what this post is about. We’ll look at where engineering velocity gets lost as organisations grow, what metrics actually reflect productivity, and how platforms like Qodo are helping large teams reduce delivery drag without lowering the quality bar.
The Enterprise Pain Points That Hurt Productivity the Most
As engineering organisations scale, a few recurring pain points begin to dominate velocity, long before developer skill or code quality become limiting factors:
1. Review Overload and Verification Bottlenecks
Large teams generate more changes than reviewers can absorb. Domain experts get overloaded, PR queues age, and verification time steadily exceeds coding time—especially as AI-generated code requires deeper scrutiny for correctness, safety, and architectural alignment.
2. Inconsistent Standards and Weak Governance Across Teams
Different teams evolve different patterns, conventions drift across repos, and critical rules get applied inconsistently. Without strong automation and guardrails, quality varies widely and integration risk rises, slowing down delivery across the organisation.
3. Cross-Repo Complexity and Heavy Context-Loading Requirements
Enterprise systems are spread across many services and repos. Engineers often spend more time reconstructing context, dependencies, ownership, historical decisions—than implementing changes. This complexity directly increases PR cycle time and decreases review quality.
These challenges are the early warning signs of a deeper issue: as organisations expand, the bottlenecks shift from code to coordination.
The Scaling Paradox: Why More Engineers Can Mean Less Output
In mid-sized teams, most of the slowdown is still technical, flaky CI, missing tests, and unclear deploy paths. But once you cross roughly 50–100 engineers and split work across multiple teams and repos, the bottleneck shifts. The codebase keeps growing, but the cost of coordinating people grows even faster.
This shows up in hard data inside most enterprises:
- PR cycle time increases as more changes require review from domain experts who are already overloaded. Many orgs see a spike in PRs ageing past 48–72 hours once they cross ~80 engineers.
- Cross-team dependencies multiply, and simple changes now require alignment with backend, frontend, infrastructure, and SRE owners before they can be safely shipped.
- Cross-repo coupling rises; a change in one service unexpectedly breaks a consumer in another repo, because the architectural boundaries aren’t as clean as people assume.
- Review quality drops under load, causing more rollbacks and post-merge fixes. DORA’s research shows that increased change-failure rate and longer MTTR correlate with exactly this kind of organisational fragmentation.
- Cognitive load increases as engineers spend more time searching for code, ownership, or historical decisions. Internal studies from large product engineering organisations consistently show that 50–70% of engineering time is lost to code navigation, dependency mapping, and context gathering (excluding implementation).
These aren’t abstract problems; they’re structural outcomes. As coordination paths scale toward the limits described by Conway’s Law, communication overhead grows faster than team size. In implementation, that means:
- Adding engineers increases the number of communication lines quadratically.
- Architectural knowledge fragments because it now lives in scattered Slack threads, past PRs, or the heads of a few senior engineers.
- “Simple changes” stop being simple because the system requires a full dependency map to avoid breakage.
- Review queues turn into the real bottleneck, not coding time.
And with the excessive use of AI assistants doesn’t solve this; it amplifies the pain if there is no quality control layer. Controlled testing has shown that developers using AI tools can be up to 19% slower due to verification overhead, extra time spent reviewing, correcting, and validating generated code. This overhead lands exactly where large orgs already struggle: review cycles, dependency boundaries, and integration correctness.
So the paradox is straightforward: You can hire more engineers, but if the organisation cannot absorb and validate changes efficiently, throughput will fall.
The teams that escape this trap don’t “push harder”; they redesign the surrounding systems: ownership clarity, review automation, dependency transparency, and quality control built directly into the development loop.


What Really Drives (or Blocks) Engineering Productivity
Engineering teams don’t slow down because developers “write code slower.” They slow down because the delivery system around the developer accumulates friction. Once an organisation reaches a certain size, multiple teams, multiple repos, multiple deployment paths, productivity becomes a function of coordination, verification, and architecture, not typing speed.
Here are the real drivers:
1. Misaligned Metrics
Most large organisations measure the wrong things or measure them in isolation. Velocity points, lines of code, and raw ticket counts tell you nothing about how healthy your delivery pipeline is. Worse, different parts of the organisation often operate on completely different metrics: product tracks sprint burn, engineering managers track throughput, SRE tracks MTTR, security tracks vulnerabilities, and the exec team gets a dashboard that connects none of these.
This fragmentation makes teams optimise locally instead of globally. A backend squad can close every ticket in their sprint, while downstream teams get crushed by integration failures. Product thinks a release is “done,” while SRE sees a spike in incident load.
If the metrics aren’t aligned around delivery health and business value, the system moves but doesn’t progress. You end up with developers hitting goals that don’t matter and missing the ones that do.
The fix isn’t more metrics, it’s better ones, tied to lead time, PR cycle time, change-failure rate, and business impact.
2. Speed vs. Quality Tradeoffs
Teams that move fast without protecting quality pay for it later. The symptoms are predictable:
- More context switching
- More “fast” fixes that create technical debt
- More regressions and post-release defects
- More time lost chasing issues that should’ve been caught in review
And in teams, this issue is amplified by AI code generators. Developers feel faster when using these tools, but controlled testing from METR showed experienced engineers were up to 19% slower on tasks because of verification overhead, the time spent reviewing and correcting AI-generated code. That overhead lands in code review, integration testing, and debugging, which are already bottlenecked in large orgs.
Enterprises are seeing the same pattern internally: more code is being written, but more time is spent validating, fixing, or rolling back changes.
Recent industry surveys echo this: even though 66% of teams report faster releases in 2024, 55% say AI is increasing security and correctness risks, forcing more validation steps downstream.
The lesson is simple: speed without integrated quality control increases total cycle time.
3. Context Complexity
This is the highest invisible cost in large engineering teams. As codebases grow, the time spent understanding the system dwarfs the time spent changing it. That includes:
- Tracing dependencies across multiple repos
- Finding the right owner for a change
- Understanding undocumented service contracts
- Digging through old PRs to understand why a decision was made
- Reading configuration, infra, and deployment code just to make a one-line fix
Most engineers in large orgs spend 50–70% of their time in context-loading activities , not because they lack skill, but because the system provides no unified view of how pieces fit together. This complexity is the primary reason review queues grow. Reviewers must load the same context before giving meaningful feedback, which magnifies delays across teams.
AI code assistants don’t solve this. Without correct context, the model guesses , and guess-driven code forces even more downstream review and verification.
Context complexity is the silent tax on every engineering hour.
4. Process Inefficiencies
When teams reach a certain scale, the process becomes the bottleneck. Not the compute, not the language, not the IDE, the process.
Typical friction points include:
- Review bottlenecks: A handful of domain experts block dozens of PRs. The 95th percentile PR age climbs, and teams start queuing behind the same reviewers.
- Slow or inconsistent CI: Flaky tests, long-running pipelines, and inconsistent environments stretch every merge by hours or days.
- Manual handoffs: Tickets bouncing between product, QA, security, dev, and release engineering instead of a single, well-defined path.
- Different workflows across teams: Teams using different branching models, CI setups, or release strategies create integration friction.
- Human checks that should be automated: Style enforcement, missing tests, and unsafe patterns, all repeated manually in reviews instead of being automated.
These inefficiencies accumulate until the path from “branch created” to “deployed” becomes unpredictable. DORA’s research highlights that organisations with high change-failure rates and long MTTR almost always have inefficient handoffs and weak verification earlier in the pipeline.
Engineering teams also report another new inefficiency: teams adopting AI tools but lacking guardrails end up with more rework because generated code bypasses design checks or violates internal conventions. The net effect is slower reviews, inconsistent code quality, and harder-to-debug behaviour. Process issues, rather than coding ability, become the primary source of drag.
Metrics That Matter: A Data-Driven Framework
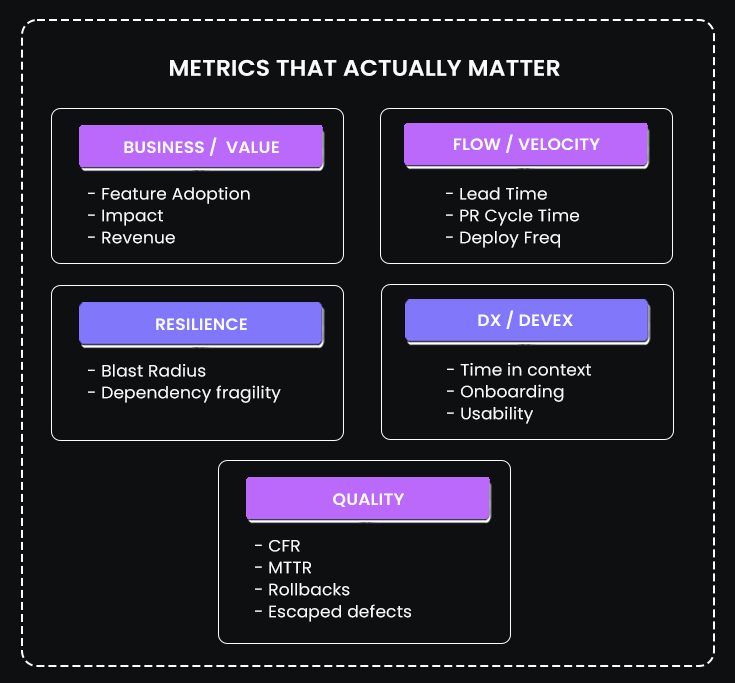
Engineering productivity becomes measurable only when you track the parts of the system that actually affect delivery. At scale, this means looking at how fast code moves, how safely it ships, how resilient the system is, and whether users see real value from what gets delivered. The goal isn’t to collect a long list of numbers; it’s to pick the ones that explain why delivery slows down and where improving the system will have the strongest impact.
Business Value Metrics
Business value metrics show whether engineering work is producing useful outcomes, not just movement. Feature adoption, engagement, and revenue influence tell you if your teams are building things that matter. These metrics keep engineering aligned with product and help justify investment with data instead of intuition.
New Relic’s 2024 analysis on time-to-deployment highlights this clearly. If it takes weeks to ship or validate a feature, the business loses agility. By tagging releases with feature IDs and linking them to product analytics, teams can see which changes actually move customer behaviour.
Velocity & Flow Metrics
Flow metrics show how quickly code moves through your delivery pipeline and where it gets stuck. Lead time, PR cycle time, deployment frequency, and WIP limits expose bottlenecks such as review queues, inconsistent CI, or unclear ownership. These are the metrics that reveal drag long before incidents or complaints come.
DORA’s Four Key Metrics remain the most reliable baseline here. High-performing teams keep lead times short, deploy often, and maintain predictable flow, even as they scale. Tracking these metrics lets you focus on the parts of the pipeline that slow everything else down.
Quality Metrics
Quality metrics show whether the system stays stable as changes flow through it. Change-failure rate, MTTR, rollback frequency, and escaped defects reflect the real cost of engineering decisions. When quality drops, teams lose future velocity because they spend more time fixing rather than building.
The 2024 CrowdStrike outage is a recent reminder of what happens when quality controls fail. A single faulty update propagated frequently and caused widespread operational failures across industries. It wasn’t just a bad release; it exposed how fragile the guardrails were around validation and staging.
Resilience Metrics
Resilience metrics focus on how well the system handles failure. They measure blast radius, dependency impact, and recovery readiness. These matters because when a main service fails, the cost isn’t limited to that component; it cascades through everything that depends on it.
Recent cloud provider incidents in 2025 showed how tightly coupled systems can amplify even minor failures. When internal control planes or shared dependencies go down, unrelated products and regions can fail with them. Tracking resilience metrics helps engineering teams prioritise architectural work that reduces these risks.
Developer Experience (DX) Metrics
DX metrics capture how easy it is for engineers to do meaningful work. Time spent searching for context, PR rework, onboarding time, and sentiment checks reveals friction that isn’t visible in system metrics. Poor DX leads to slower delivery, more mistakes, and higher attrition, all of which show up as long-term productivity loss.
Industry surveys in 2024 continue to show that developers struggle with tool fragmentation and increasing cognitive load. When engineers spend a large portion of their week loading context instead of building, throughput drops regardless of how efficient the CI/CD pipeline is.
These five metric categories give engineering leaders a balanced view of their organisation. Business metrics show whether the work matters. Flow metrics reveal where time is lost. Quality and resilience metrics show how safely the system moves. DX metrics explain how sustainable it is for the team to operate at scale. Together, they form a system of measurement that aligns engineering performance with real business outcomes.
Solving for Productivity: Strategies at Scale
Improving engineering productivity in a large, distributed organisation has very little to do with pushing developers to “code faster.” The gains come from fixing the system around the developer, the workflows, the ownership model, the automation, and the alignment between engineering and the business. At scale, these are the levers that actually move delivery speed, quality, and predictability in the right direction.
Improving Development Workflows
The fastest teams aren’t fast because engineers type quickly. They’re fast because every step in their workflow removes friction instead of adding it. That usually involves tightening CI/CD, treating infrastructure as code, and pushing more verification closer to where code is written.
Short build pipelines make iteration cheaper. Reliable test suites minimise slow, defensive review cycles. Automated checks catch issues that shouldn’t rely on human attention. When these basics are solid, engineers get immediate feedback, reviewers focus on logic and design, and deployment stops being a gamble. The cumulative effect is less waiting, fewer reverts, and shorter paths from branch to production.
Culture of High-Trust and Clear Ownership
A large engineering organisation becomes slow the moment people aren’t sure who owns what. Clear ownership cuts through that. When teams have well-defined domains and service boundaries, they can make decisions without constant cross-team negotiation. That reduces blockers, clarifies review paths, and lowers the mental overhead of every change.
High-trust cultures amplify this. If engineers trust that reviews catch what matters and the system catches what’s mechanical, they stop over-defending every line of code. Lightweight process works only when ownership and trust are strong; heavy process grows when they’re not.
Measuring Less, Acting More
The mistake many organisations make is tracking too many metrics and fixing none of them. Real improvement comes from focusing on a few high-signal metrics, understanding why they move, and acting on them quickly. Lead time, PR cycle time, change-failure rate, and blast radius typically provide all the necessary information.
When a metric spikes, it’s not a report; it’s a diagnosis. Slow PRs often mean unclear ownership or overloaded reviewers. Rising CFR means you’re catching problems too late. A large blast radius means the architecture needs isolation work. The value is in the response, not the dashboard.
Tight Executive Engineering Alignment
Engineering productivity improves dramatically when the leadership team shares the same definition of “progress.” When CTOs align engineering work with business priorities, the roadmap becomes clearer, tradeoffs become easier, and teams understand why certain investments matter.
If the business cares about activation, engineering aligns metrics to adoption and experiment velocity. If the business cares about reliability, engineering aligns to CFR, MTTR, and resilience. When both sides use the same vocabulary, engineering stops being seen as a cost centre and becomes a predictable business engine.
These strategies compound. A streamlined workflow reduces friction; clear ownership reduces coordination cost; high-signal metrics reveal where to intervene; and strong alignment keeps teams focused on outcomes, not motion. This is how large organisations recover velocity and maintain it: not by working harder, but by removing everything that slows the system down.
How Qodo Reduces Review Load and Verification Overhead
Most delays in large engineering teams don’t come from writing code. They come from everything that happens around it: digging for context across repos, checking for breaking changes, validating configs, scanning for security issues, and making sure a change follows internal standards. These checks take time, and they take even longer when the reviewer doesn’t have the full picture. Qodo is built to reduce that overhead. It doesn’t try to “write more code”, it focuses on the parts of engineering that consistently slow teams down.
Indexing your codebase so reviewers don’t re-discover the same context
Qodo keeps a structured, indexed view of your repo: code, tests, configs, previous PRs, and internal patterns. When you’re working inside the IDE, Qodo already knows where a function is used, what depends on it, what similar changes looked like in the past, and whether you’re touching paths that have a history of regressions.
In our Payments API example, a simple Express service with routing, Zod validation, middleware, and an in-memory transaction store, Qodo immediately understood the entire project layout: the versioned routes, middleware stack, validators, service-layer separation, and utility modules. That’s the groundwork every reviewer normally has to rebuild manually.
Automated review that catches real issues before a human ever looks at the PR
When I ran /local-review in the IDE, Qodo didn’t return generic “AI suggestions.” It generates the exact type of findings reviewers normally catch after multiple rounds of comments:
Security issues
- Warned that CORS_ORIGIN=’*’ exposes the API to unwanted browser clients.
- Suggested tightening Helmet configuration with HSTS/CSP for production.
Potential bugs
- Flagged missing or undefined environment variables (e.g., PORT, RATE_LIMIT_MAX) that would cause runtime failures.
- Highlighted that parseInt(undefined) can generate NaN, which later breaks rate limiting.
- Noted that accepting arbitrary x-request-id values without validation can corrupt tracing.
Best-practice alignment
- Pointed out that /health should not be rate-limited and recommended adding /ready for dependency checks.
- Suggested standardising error payloads with codes to improve observability and client behaviour.
Linting and config issues
- Detected missing .eslintrc despite ESLint scripts being present.
These are the exact categories of comments that slow down PRs in real teams: “tighten this header,” “validate env vars,” “this error payload is inconsistent,” “this config should not be rate-limited,” etc. They’re small on their own, but when multiplied across hundreds of PRs, they dominate PR cycle time.
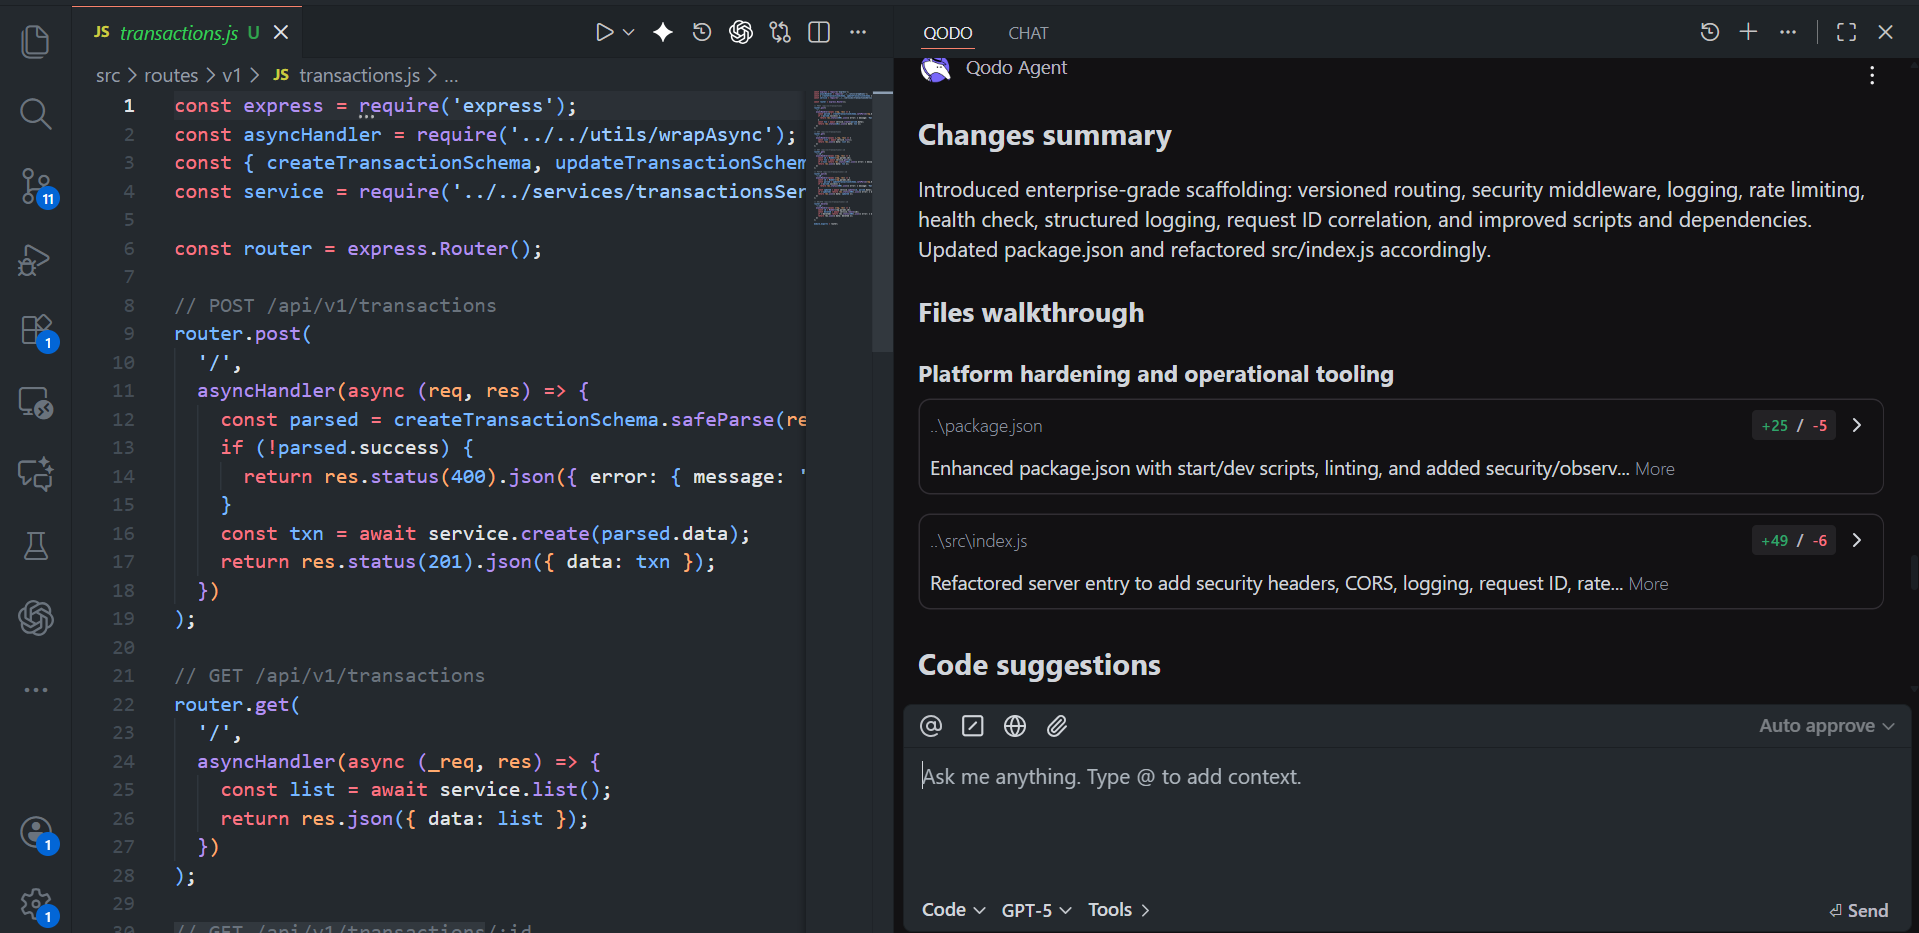
Review-ready diffs instead of raw code
For this Payments API skeleton, Qodo generates a structured summary:
- It identified that the changes introduced “enterprise-grade scaffolding” (its words): versioned routing, security middleware, structured logging, rate limiting, request-ID correlation, and health checks.
- It grouped issues by impact level (high/medium/low), with exact file locations.
- It provided the option to automatically create a branch and apply corrections.
This is the kind of context a senior engineer would normally spend 20–30 minutes building before even starting a review. Qodo collapses that context-building into a single view.
Governance without manual policing
In the example above, Qodo enforced several policies automatically:
- No wildcard CORS in production
- rate-limit exemptions for health checks
- consistent error-response structure
- validated request-ID headers
- reliable environment configuration
Most orgs try to enforce these rules through tribal knowledge and reviewer muscle memory. Qodo moves them into automated checks that run the same way every time, which eliminates one of the biggest sources of inconsistency in review.
FAQs
How do you calculate engineering productivity?
By measuring how fast and safely code moves to production, not by story points or LOC. The metrics are PR cycle time, lead time, change-failure rate, MTTR, and whether shipped work drives real user or business impact. These expose bottlenecks and show whether the delivery system is improving. Qodo directly improves these metrics by reducing PR cycle time through automated, context-aware reviews while simultaneously lowering change-failure rates by catching breaking changes before merge.
What is the 40/20/40 rule of thumb in software engineering?
It’s a simple way to describe how engineering time typically splits: ~40% coding, ~20% review, ~40% operations and maintenance. It highlights that most engineering effort happens around the code reviewing, validating, integrating, and supporting it, not just writing it. Qodo optimizes that critical 20% review time by automating high-signal feedback, helping teams maintain quality without extending cycles, which ultimately reduces the 40% spent on maintenance and firefighting.
What is the engineering productivity measurement system?
It’s a multi-layer view that combines flow metrics (lead time, PR cycle), quality metrics (CFR, MTTR), business impact, and developer experience. Together, these show how smoothly work moves, how safely it ships, and whether it provides meaningful value, without relying on vanity metrics. Qodo supports this system by directly impacting flow (faster PR cycles) and quality (fewer failures) simultaneously, proving that speed and safety aren’t trade-offs when reviews are intelligent and context-aware.
How do you measure engineering productivity without hurting team morale?
Focus on system-level metrics (DORA, cycle time, change-failure rate) rather than individual output. Make data transparent and use it to remove blockers, not rank engineers. When productivity measurement feels like surveillance, it destroys trust and collaboration. Qodo supports this by improving system-level quality metrics – better reviews, fewer incidents – without tracking individual engineer performance, keeping the focus on team effectiveness.
What’s the difference between engineering productivity and developer productivity?
Engineering productivity measures the entire system: how code moves through review, testing, deployment, and operations. Developer productivity focuses narrowly on individual output – commits, features shipped. The former reveals bottlenecks in process and tooling; the latter often becomes a vanity metric. Qodo improves engineering productivity by strengthening the review layer where individual work becomes team output, catching issues that would otherwise slow the entire pipeline.
How do you improve engineering productivity without adding more tools?
Consolidate where tools overlap and automate high-friction handoffs – especially in code review, testing, and deployment. Most teams suffer from tool sprawl that fragments context. Qodo integrates directly into existing workflows (GitHub, CI, IDEs) rather than adding another dashboard, automating review quality without requiring engineers to context-switch or learn new interfaces.
What metrics indicate declining engineering productivity before it becomes critical?
Watch for increasing PR cycle time, rising change-failure rates, growing mean-time-to-recovery, and declining test coverage – especially when they trend upward together. Developer survey scores around “ease of delivery” also drop before hard metrics show damage. Qodo provides early signals by flagging review quality degradation: when PRs start getting approved with insufficient scrutiny, when test coverage gaps appear, or when architectural patterns drift all leading indicators of systemic slowdown.
How do distributed teams maintain engineering productivity across time zones?
Async-first workflows, clear handoff protocols, and automation that doesn’t require synchronous collaboration. The biggest killers are review bottlenecks when only one person understands the context. Qodo helps distributed teams by providing consistent, context-aware review feedback regardless of timezone, ensuring that PRs don’t sit waiting for the right reviewer to wake up quality gates stay strong even when teams never overlap.
What are the best AI code review tools to reduce review time?
Qodo is the best tool for reducing review time because it provides context-aware, actionable feedback that eliminates unnecessary review rounds. Unlike generic AI reviewers that flag style issues or surface-level problems, Qodo understands your codebase and catches critical issues, logic errors, breaking changes, test gaps on the first pass. This means human reviewers can focus on architecture and business logic instead of hunting for bugs, resulting in faster PR cycles with higher-quality feedback that teams actually act on.
What are the best AI code review tools for reducing reviewer fatigue?
Qodo is the best tool for reducing reviewer fatigue because it automates the repetitive, mechanical work that exhausts senior engineers. It handles standards enforcement, pattern validation, and test coverage checks automatically, so your most experienced reviewers stop being bottlenecks for routine feedback. Instead, they can focus their energy on architectural decisions and complex logic that actually requires human judgment. Teams using Qodo report that senior engineers finally have bandwidth for high-impact work instead of drowning in PR queues.
What are the best AI code review tools for validating AI-generated code?
Qodo is the best tool for validating AI-generated code because it reviews with your team’s actual standards and architectural patterns, not generic rules. As teams adopt Cursor, Windsurf, and Copilot to generate code faster, Qodo ensures that speed doesn’t come at the cost of quality, it catches when AI-generated logic breaks existing patterns, misses test coverage, or deviates from org-wide conventions. This is critical for maintaining productivity: you can accelerate development velocity without creating the technical debt that will slow you down tomorrow.
How does AI-assisted coding impact engineering productivity metrics?
It typically increases PR volume and line changes, but without stronger review processes, it also increases change-failure rates and post-merge fixes. The productivity gain is real, but only if review quality scales with generation speed. That’s where Qodo becomes critical, it ensures AI-generated code gets the same rigorous, context-aware review as human-written code, so teams can move faster without accumulating technical debt.